Fig. 16.
Download original image
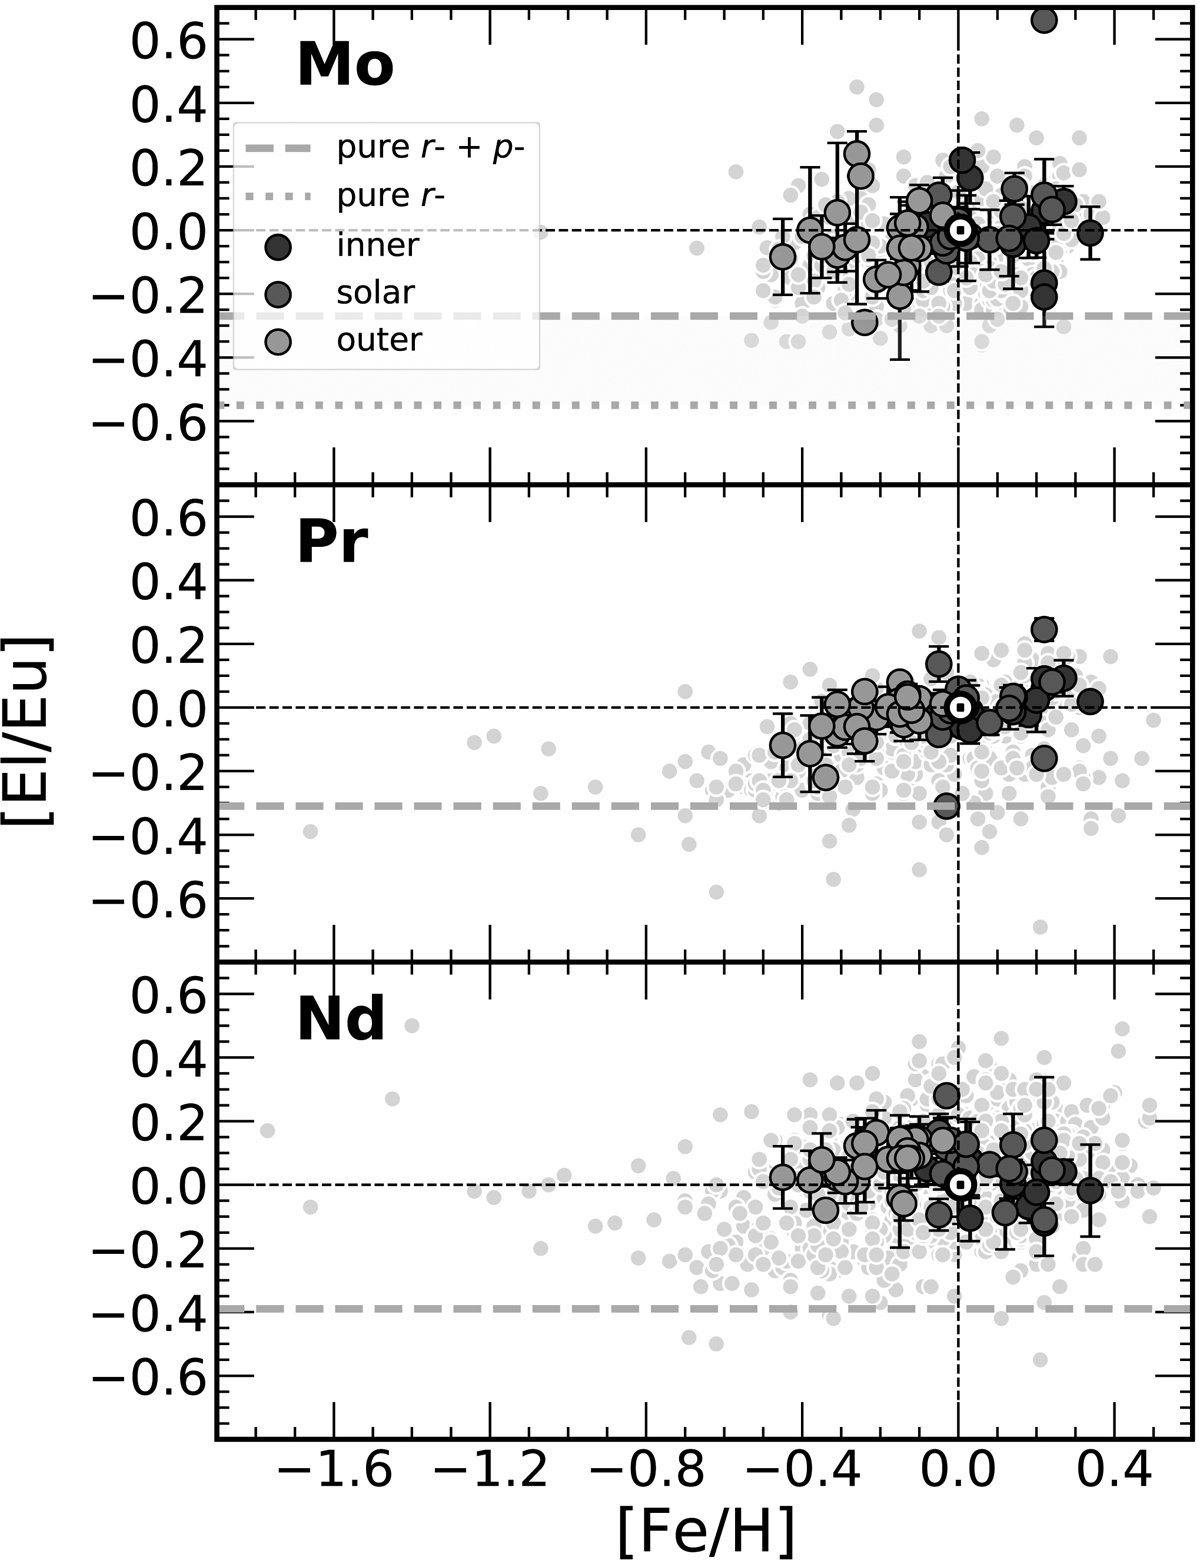
[El/Eu] vs. [Fe/H] for the mixed elements: Mo, Pr, and Nd. Data for both the field-star sample and OC sample are shown. The symbols and colours are the same as in Fig. 4. The dashed yellow lines track the pure contribution of the r-process derived using the solar abundances from Grevesse et al. (2007), and the most recent percentages from Prantzos et al. (2020) for the r-process and the r- + p-process for Mo.
Current usage metrics show cumulative count of Article Views (full-text article views including HTML views, PDF and ePub downloads, according to the available data) and Abstracts Views on Vision4Press platform.
Data correspond to usage on the plateform after 2015. The current usage metrics is available 48-96 hours after online publication and is updated daily on week days.
Initial download of the metrics may take a while.