Open Access
Fig. 11.
Download original image
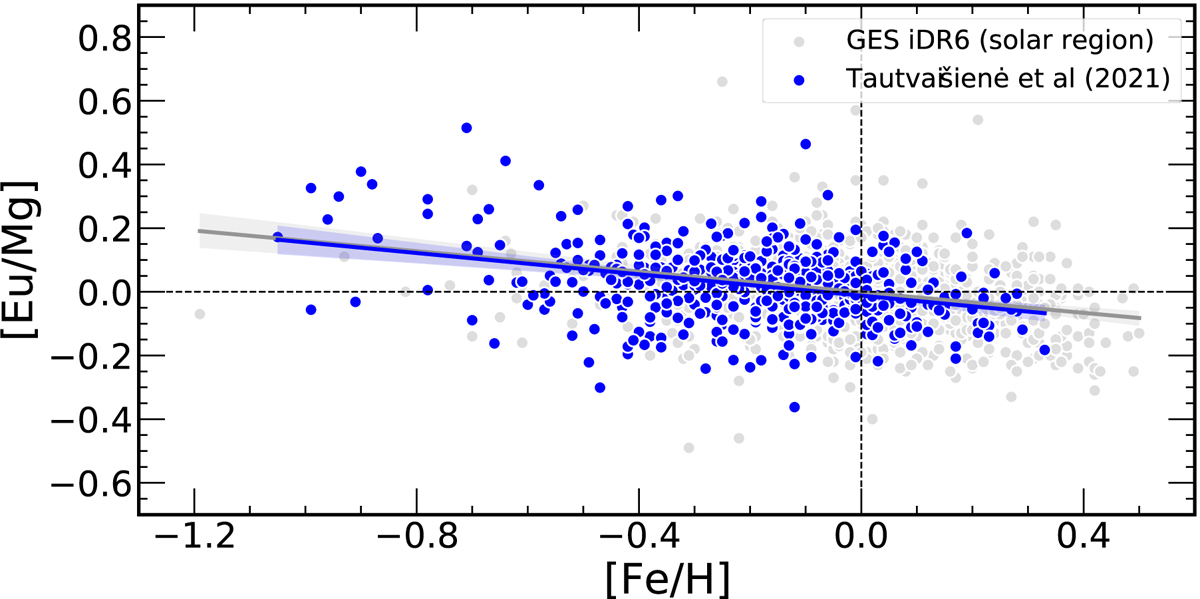
[Eu/Mg] vs. [Fe/H] for our sample of field stars (grey dots) in the solar region, compared to those of Tautvaišienė (2021) in the solar neighbourhood (blue dots). The solid lines represent the linear regression lines, which seem to coincide for both samples, and the shaded regions show the confidence interval.
Current usage metrics show cumulative count of Article Views (full-text article views including HTML views, PDF and ePub downloads, according to the available data) and Abstracts Views on Vision4Press platform.
Data correspond to usage on the plateform after 2015. The current usage metrics is available 48-96 hours after online publication and is updated daily on week days.
Initial download of the metrics may take a while.