Open Access
Fig. 1.
Download original image
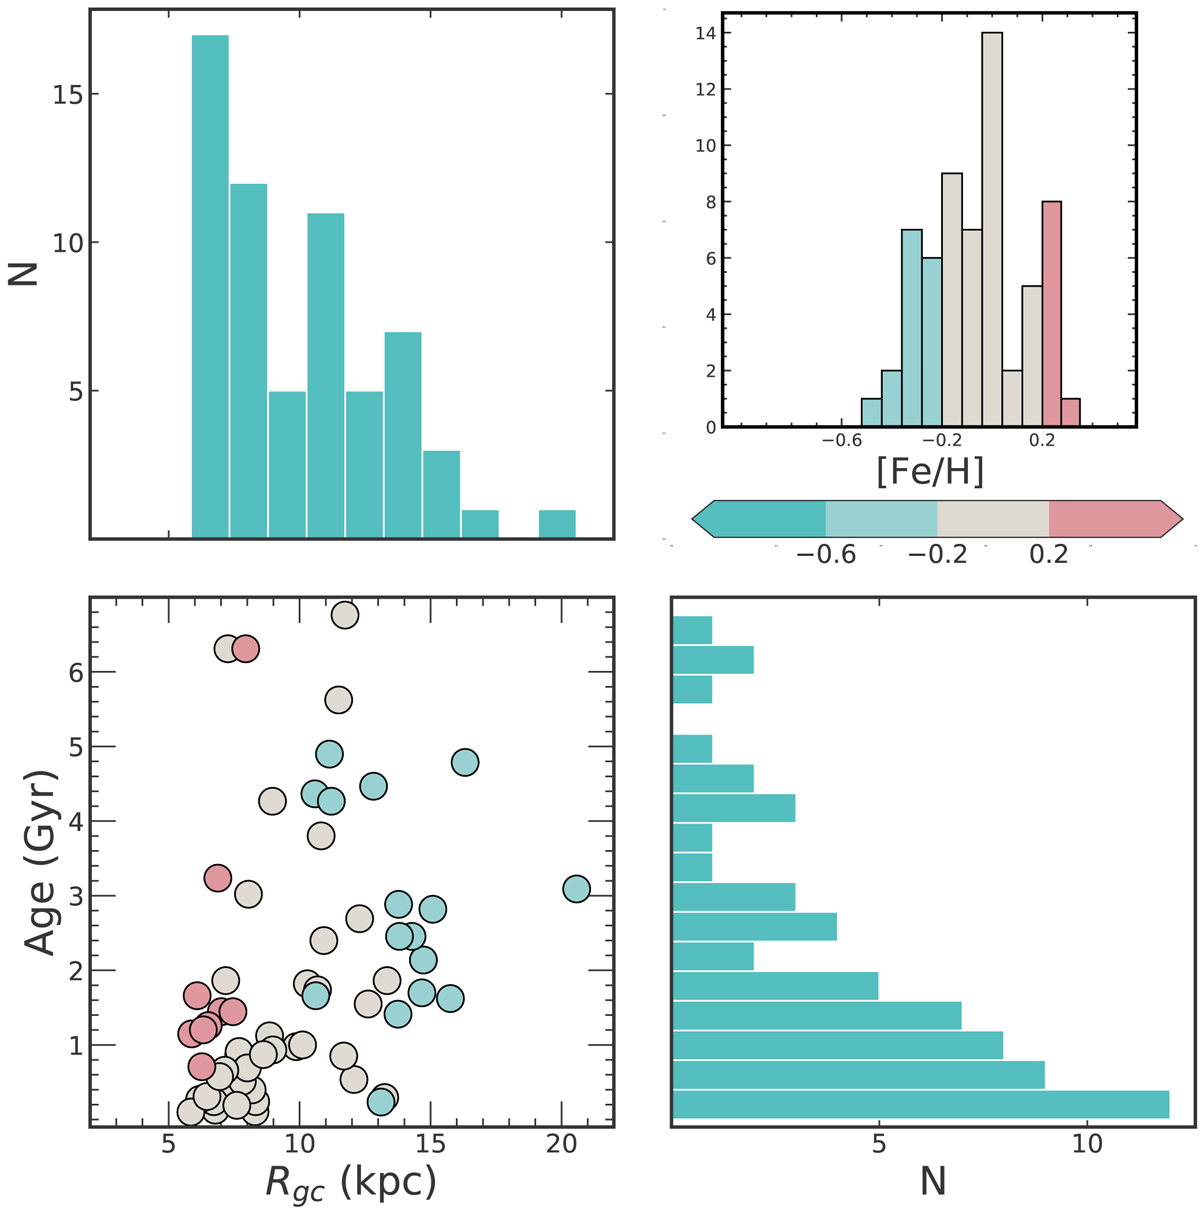
Properties of our sample of 62 OCs. Upper left panel: histogram of RGC. Lower left panel: distribution of clusters in the age vs. RGC plane, colour-coded by [Fe/H]. Upper right panel: histogram of cluster metallicity. Lower right panel: histogram of the ages.
Current usage metrics show cumulative count of Article Views (full-text article views including HTML views, PDF and ePub downloads, according to the available data) and Abstracts Views on Vision4Press platform.
Data correspond to usage on the plateform after 2015. The current usage metrics is available 48-96 hours after online publication and is updated daily on week days.
Initial download of the metrics may take a while.