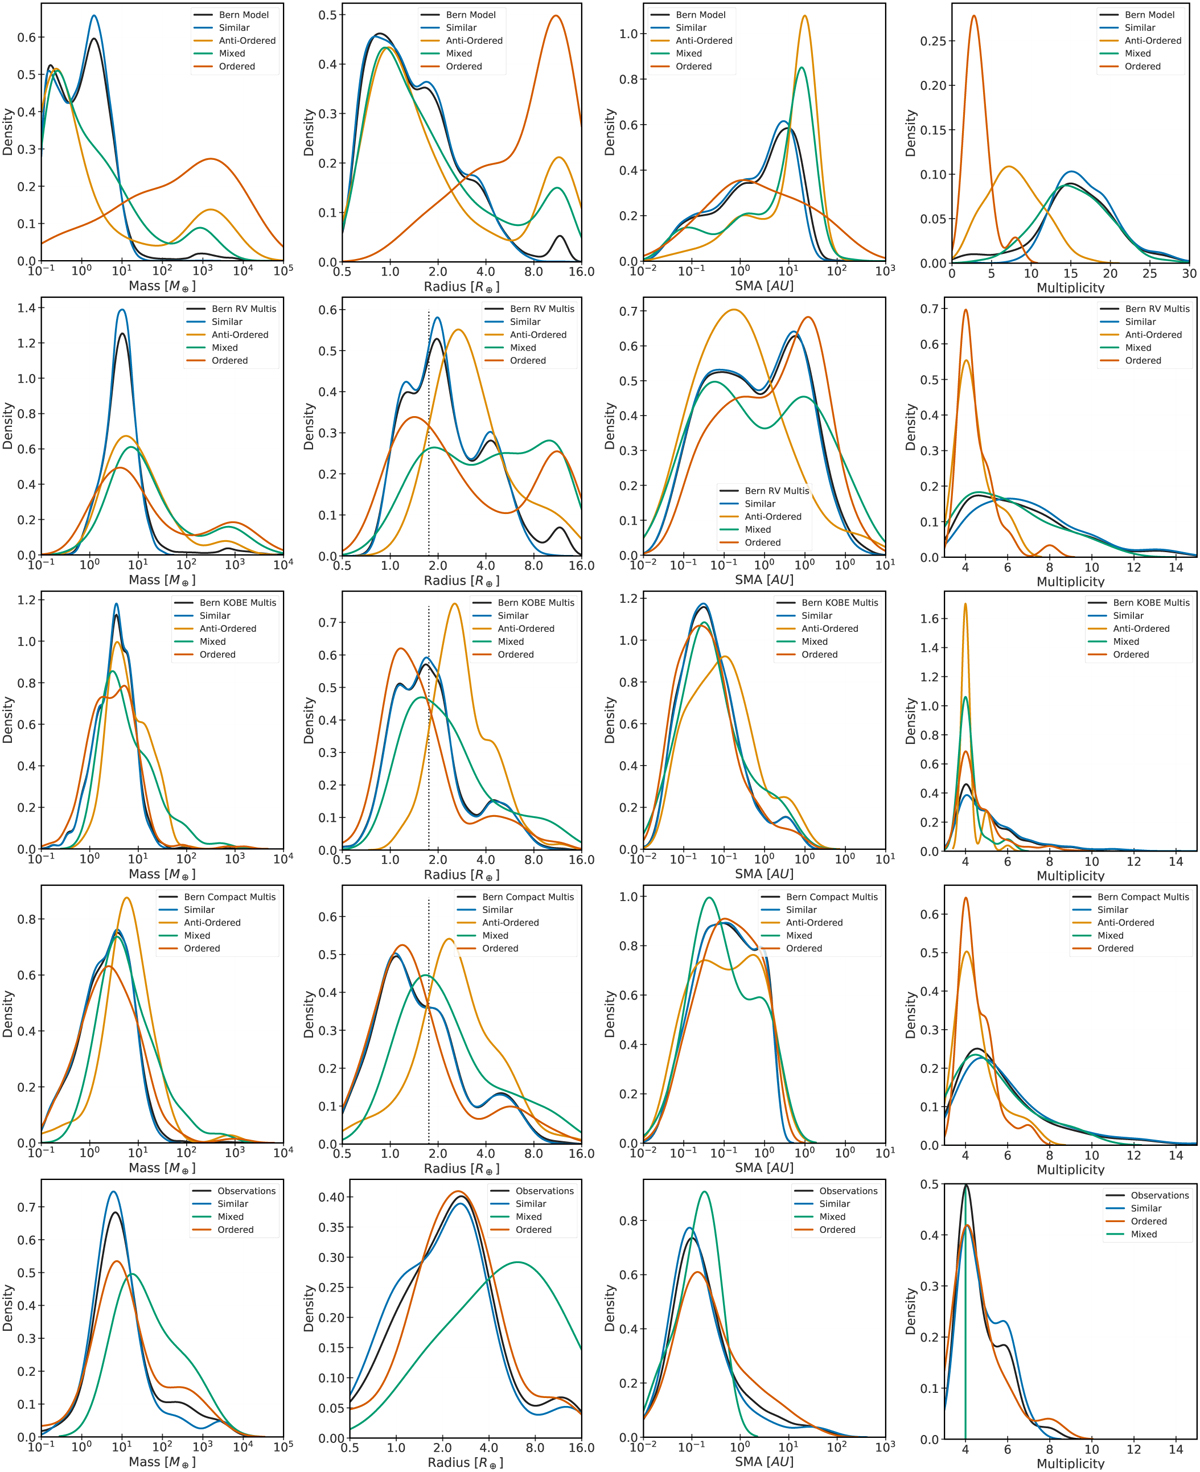
Fig. 7
Download original image
Characteristics of the architecture classes. These plots show the distribution of various quantities (columns) as function of different catalogues (rows). Left to right: distributions of mass, radius, distance, and multiplicity in the following catalogues (top to bottom): Bern model, Bern RV Multis, Bern KOBE Multis, Bern Compact Multis, and observations. All catalogues are described in Sect. 2. Some notable features from these plots are discussed in Sect. 4. All individual distributions are normalised such that the area under each curve sums to unity. The dotted vertical line in the radius distributions marks 1.75 R⊕ – approximately, the location of the well-known gap in the radius distribution (Fulton et al. 2017). Since there are only two mixed systems with the same multiplicity (n = 4) in our observations catalogue, a vertical line replaces the density kernel. The Gaussian density kernels in all other cases were estimated using Scott’s rule (Scott 2015).
Current usage metrics show cumulative count of Article Views (full-text article views including HTML views, PDF and ePub downloads, according to the available data) and Abstracts Views on Vision4Press platform.
Data correspond to usage on the plateform after 2015. The current usage metrics is available 48-96 hours after online publication and is updated daily on week days.
Initial download of the metrics may take a while.