Fig. 14
Download original image
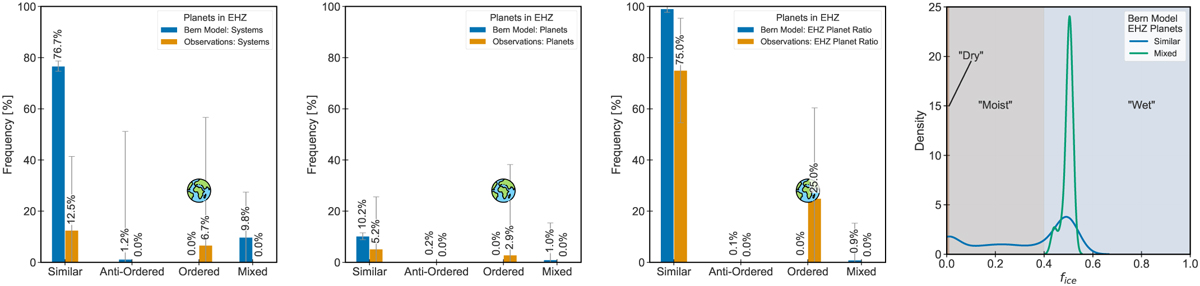
Planets inside the empirical habitable zone (EHZ). The left-most plot shows the frequency of planetary systems, of a given architecture class, which host at least one planet inside the EHZ. The central-left plot shows the fraction of planets inside a given architecture class which are in the EHZ. The central-right plot shows the fraction of all EHZ planets within a given architecture class. The rightmost plot shows the distribution of ƒice for EHZ planets across the architecture classes. The cartoon sketch of Earth emphasises that the only known life-harbouring planet resides in an ordered system. The length of error bars visualises the total number of systems or planets in respective bin as: 100/ bin eounts. The lengths of the error bars represents the number of planetary systems (left-most panel) and the number of planets (two middle panels) which are inside the bin. Large error bars in the leftmost panel, for example for anti-ordered architecture emerges from their low count (see Fig. 5). The Gaussian kernel is estimated using Scott’s rule (Scott 2015).
Current usage metrics show cumulative count of Article Views (full-text article views including HTML views, PDF and ePub downloads, according to the available data) and Abstracts Views on Vision4Press platform.
Data correspond to usage on the plateform after 2015. The current usage metrics is available 48-96 hours after online publication and is updated daily on week days.
Initial download of the metrics may take a while.