Fig. 11
Download original image
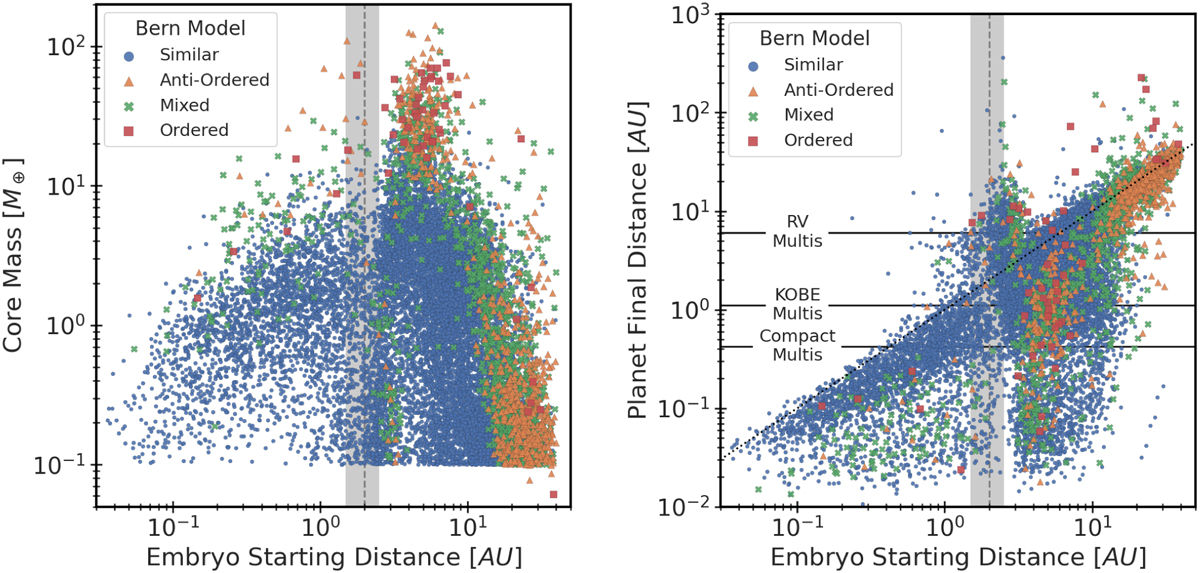
Role of starting location. Plot shows the planetary core mass (left) and final distance (right) versus the starting distance. The marker style indicates the architecture of the system to which the planet belongs. The vertical grey shaded region indicates the evolving locations of the ice line (Burn et al. 2019). The dotted line in the right panel shows the y = x line.
Current usage metrics show cumulative count of Article Views (full-text article views including HTML views, PDF and ePub downloads, according to the available data) and Abstracts Views on Vision4Press platform.
Data correspond to usage on the plateform after 2015. The current usage metrics is available 48-96 hours after online publication and is updated daily on week days.
Initial download of the metrics may take a while.