Fig. 7
Download original image
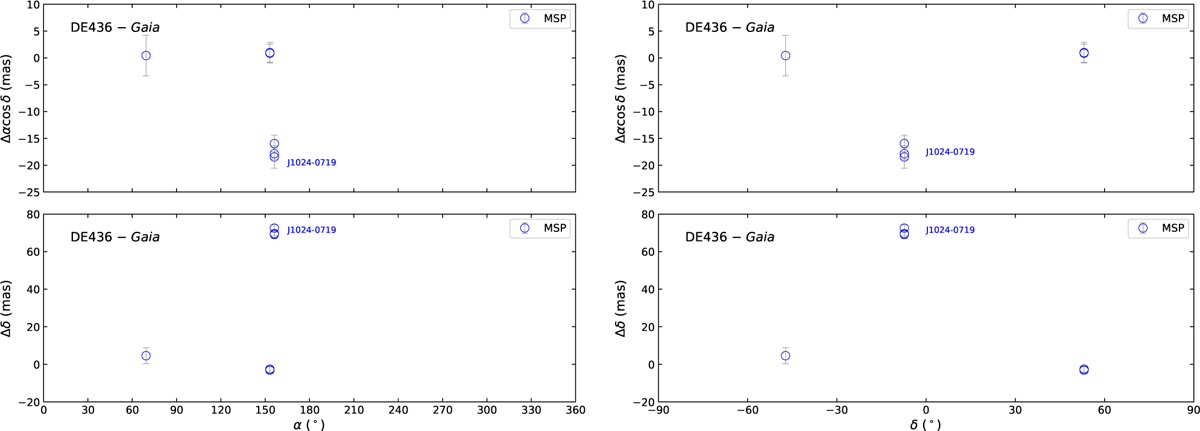
Positional differences between timing positions in the DE436 frame and Gaia DR3 positions as a function of right ascension (left) and declination (right). Data points for MSPs and non-MSPs are indicated by blue circles and red squares, respectively. The error bars show the associated formal uncertainties calculated from Eqs. (4)–(5), corresponding to a confidence level of 68%.
Current usage metrics show cumulative count of Article Views (full-text article views including HTML views, PDF and ePub downloads, according to the available data) and Abstracts Views on Vision4Press platform.
Data correspond to usage on the plateform after 2015. The current usage metrics is available 48-96 hours after online publication and is updated daily on week days.
Initial download of the metrics may take a while.