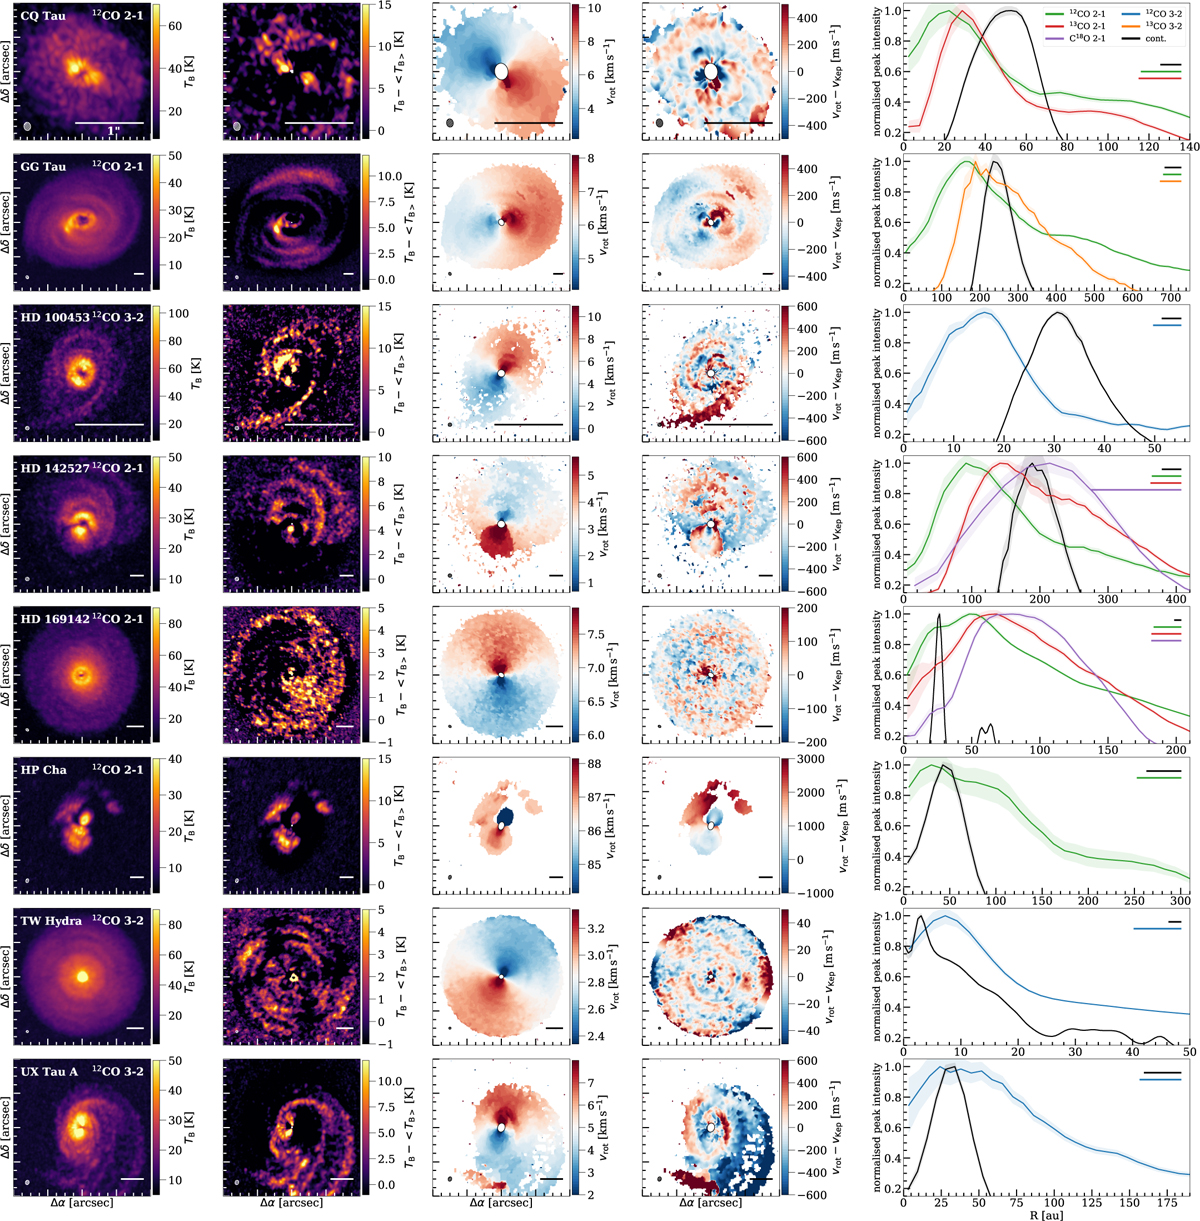
Fig. 7
Download original image
Brightness temperature and velocity maps as well as their corresponding residuals and radial profiles, shown for the eight targets with the clearest substructures. The circle and bar in the bottom left and bottom right corner of the maps indicate the beam and a 1″ scale, respectively. For the radial profiles, the major beam of each observations is indicated by the bars in the top right corner.
Current usage metrics show cumulative count of Article Views (full-text article views including HTML views, PDF and ePub downloads, according to the available data) and Abstracts Views on Vision4Press platform.
Data correspond to usage on the plateform after 2015. The current usage metrics is available 48-96 hours after online publication and is updated daily on week days.
Initial download of the metrics may take a while.