Fig. E.1
Download original image
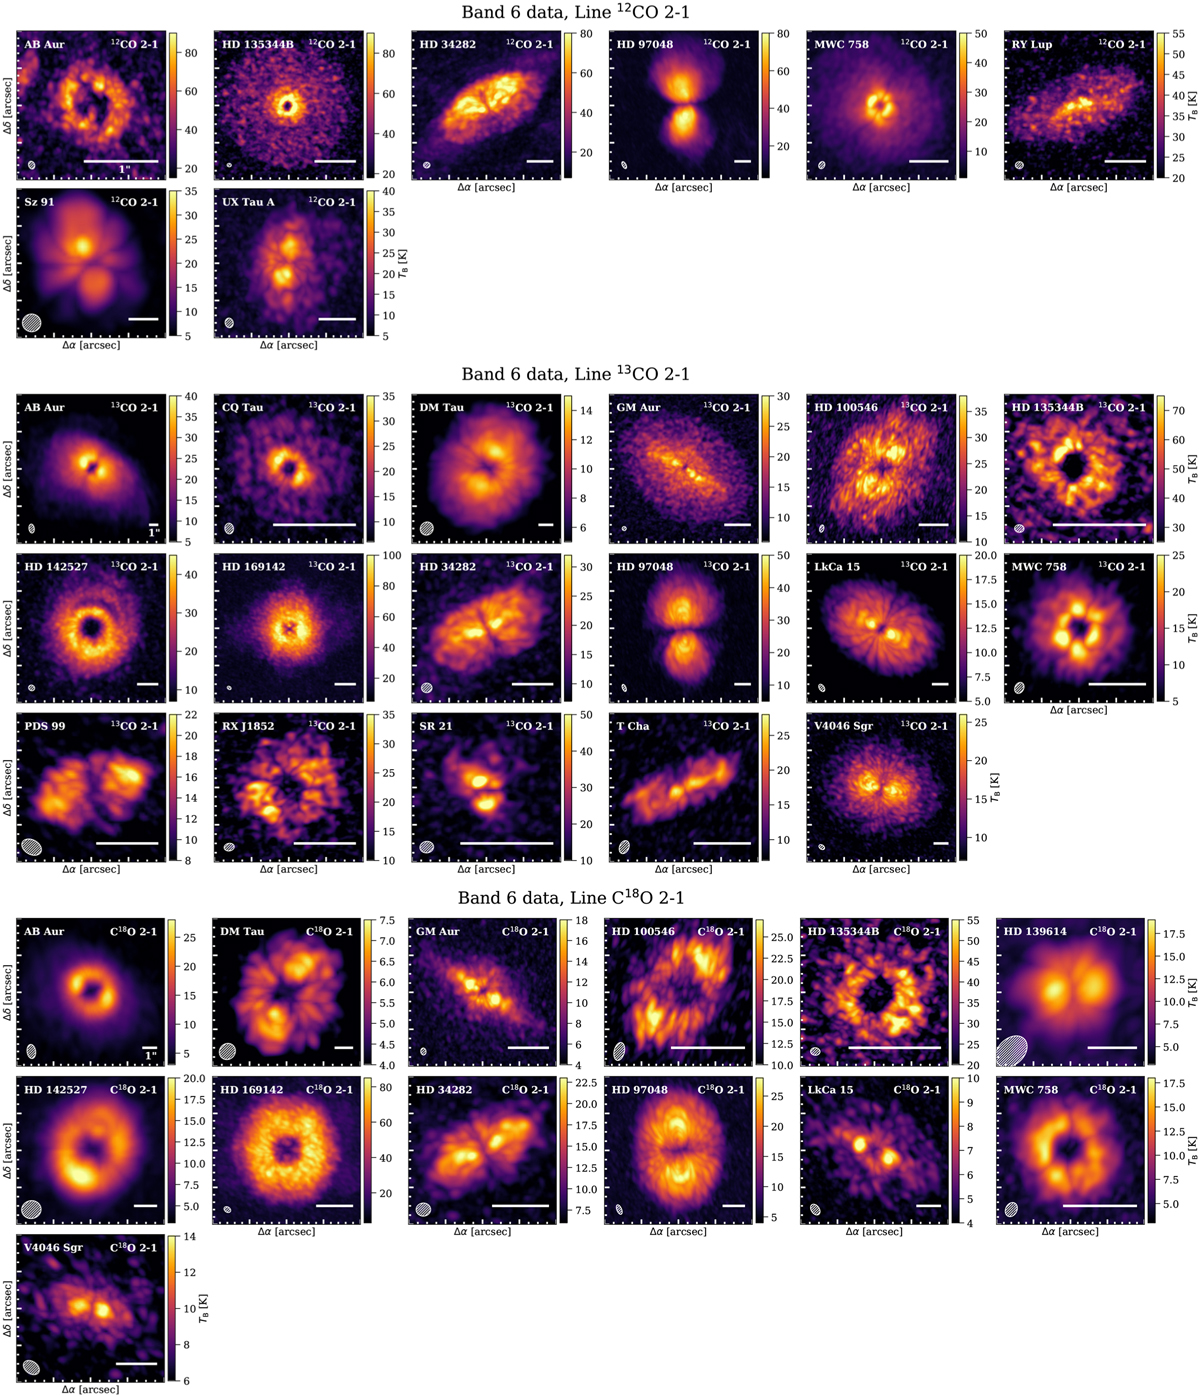
Peak brightness temperature maps of the gas emission in our targets, shown for the additional Band 6 CO lines used in this analysis. The conversion from peak intensity to units of Kelvin was done with the Planck law. The circle and bar in the bottom left and bottom right corner of each panel indicate the beam and a 1″ scale, respectively.
Current usage metrics show cumulative count of Article Views (full-text article views including HTML views, PDF and ePub downloads, according to the available data) and Abstracts Views on Vision4Press platform.
Data correspond to usage on the plateform after 2015. The current usage metrics is available 48-96 hours after online publication and is updated daily on week days.
Initial download of the metrics may take a while.