Fig. 7.
Download original image
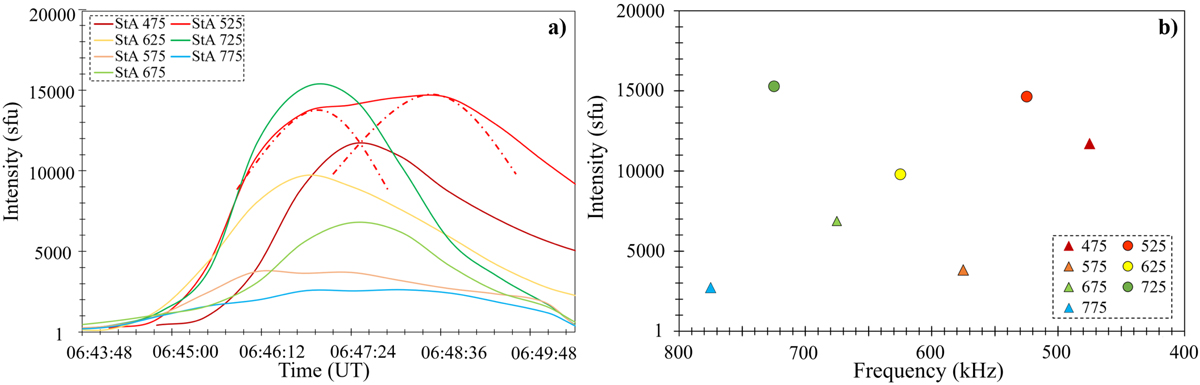
Spectral characteristics of the striae and envelope in the frequency range 800–450 kHz. Panel (a) shows the time profiles of the SE and their envelope in the given frequency range. The red dotted Gaussian curves represent the two-peak morphology of the 525 kHz frequency band. Panel (b) shows the amplitude of the striae and envelope presented in panel (a). The triangles and circles represent the peak amplitude of the envelope and stria elements, respectively.
Current usage metrics show cumulative count of Article Views (full-text article views including HTML views, PDF and ePub downloads, according to the available data) and Abstracts Views on Vision4Press platform.
Data correspond to usage on the plateform after 2015. The current usage metrics is available 48-96 hours after online publication and is updated daily on week days.
Initial download of the metrics may take a while.