Open Access
Fig. 3
Download original image
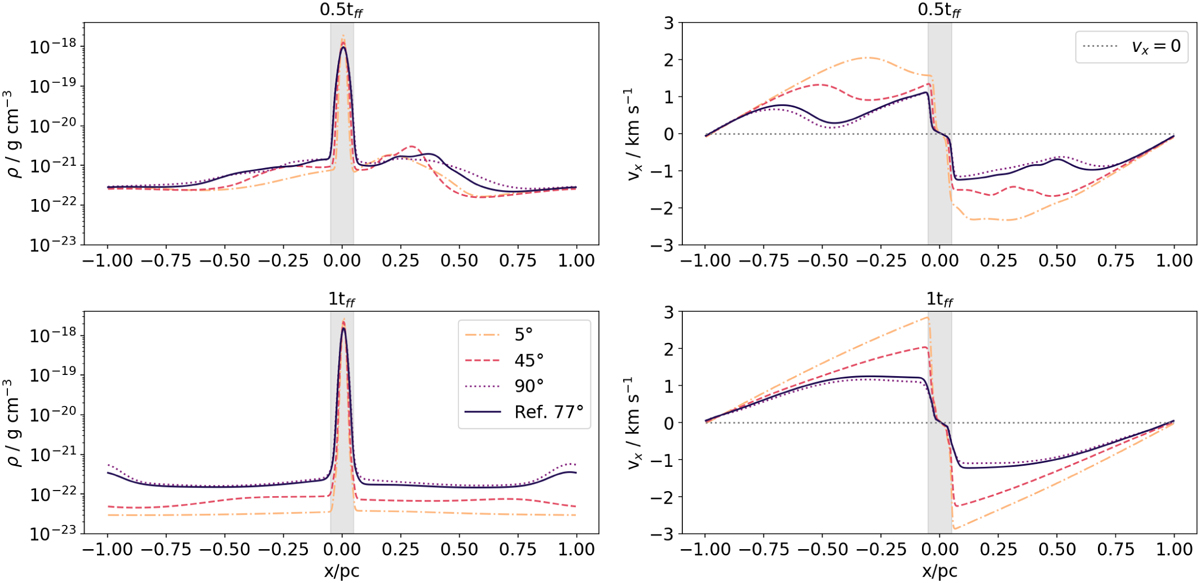
Density and velocity along the x-axis for different initial angles. The solid line corresponds to the reference case. At 0.5tff in the top panels and at 1.0tff in the bottom panels. The gray area in the middle corresponds to 0.1 pc to guide the reader to identify the typical width of the filaments.
Current usage metrics show cumulative count of Article Views (full-text article views including HTML views, PDF and ePub downloads, according to the available data) and Abstracts Views on Vision4Press platform.
Data correspond to usage on the plateform after 2015. The current usage metrics is available 48-96 hours after online publication and is updated daily on week days.
Initial download of the metrics may take a while.