Fig. 7.
Download original image
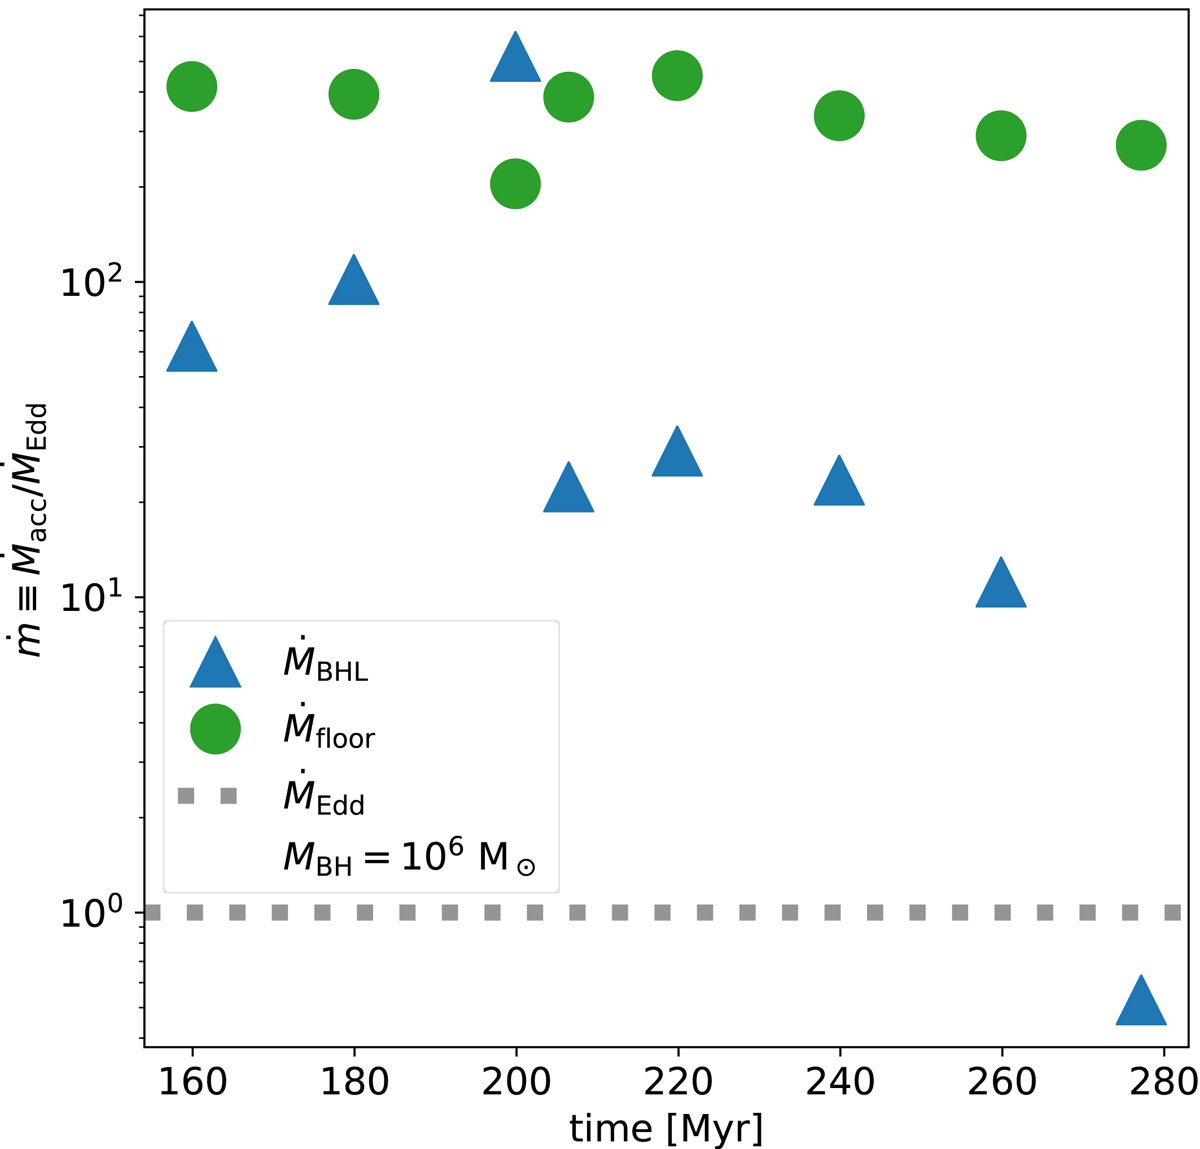
Evolution of the normalized accretion rate ṁ ≡ Ṁacc/ṀEdd for the isolated 1011 M⊙ halo, assuming that a MBH = 106 M⊙ were present. The BHL and floor accretion rates are shown in blue and green respectively and the Eddington limit by the dotted line at 1. There is enough mass available for accretion thanks to the high density present in the central region at the start, which allows for both the BHL and floor accretion rates to be above the limit.
Current usage metrics show cumulative count of Article Views (full-text article views including HTML views, PDF and ePub downloads, according to the available data) and Abstracts Views on Vision4Press platform.
Data correspond to usage on the plateform after 2015. The current usage metrics is available 48-96 hours after online publication and is updated daily on week days.
Initial download of the metrics may take a while.