Fig. 18.
Download original image
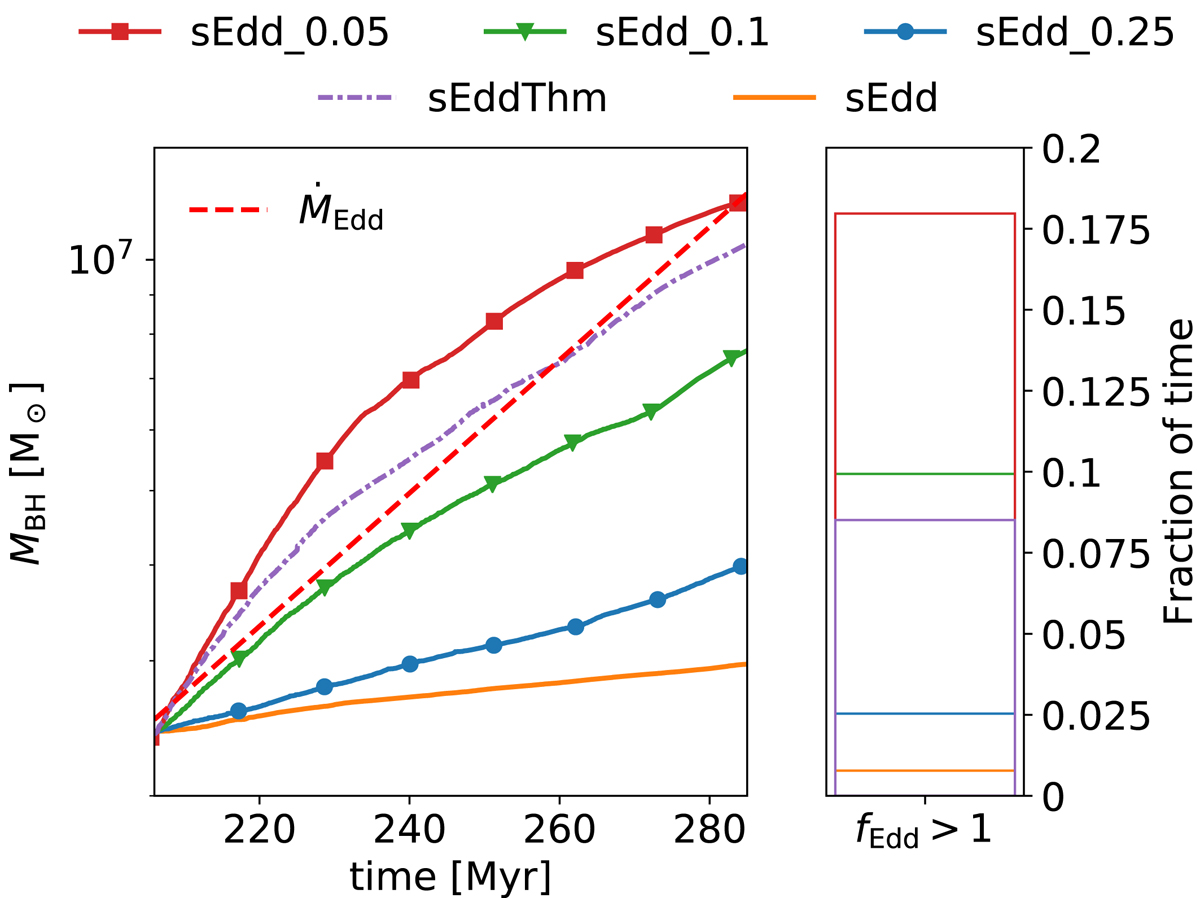
Left: evolution of the BH mass for the ‘sEdd_0.05’ (red square), ‘sEdd_0.1’ (green triangles) and ‘sEdd_0.25’ (blue circle) from the moment super-Eddington was allowed (t = 206.4 Myr). For comparison are added ‘sEdd’ (solid orange) and ‘sEddThm’ (densely dash-dotted violet) as well as the Eddington limit ṀEdd (dashed red). Right: fraction of time spent in the super-Eddington regime for the same simulations (same colors). Weaker super-Eddington kinetic feedback affects positively the BH growth and increases the fraction of time spent in the super-Eddington regime.
Current usage metrics show cumulative count of Article Views (full-text article views including HTML views, PDF and ePub downloads, according to the available data) and Abstracts Views on Vision4Press platform.
Data correspond to usage on the plateform after 2015. The current usage metrics is available 48-96 hours after online publication and is updated daily on week days.
Initial download of the metrics may take a while.