Fig. 17.
Download original image
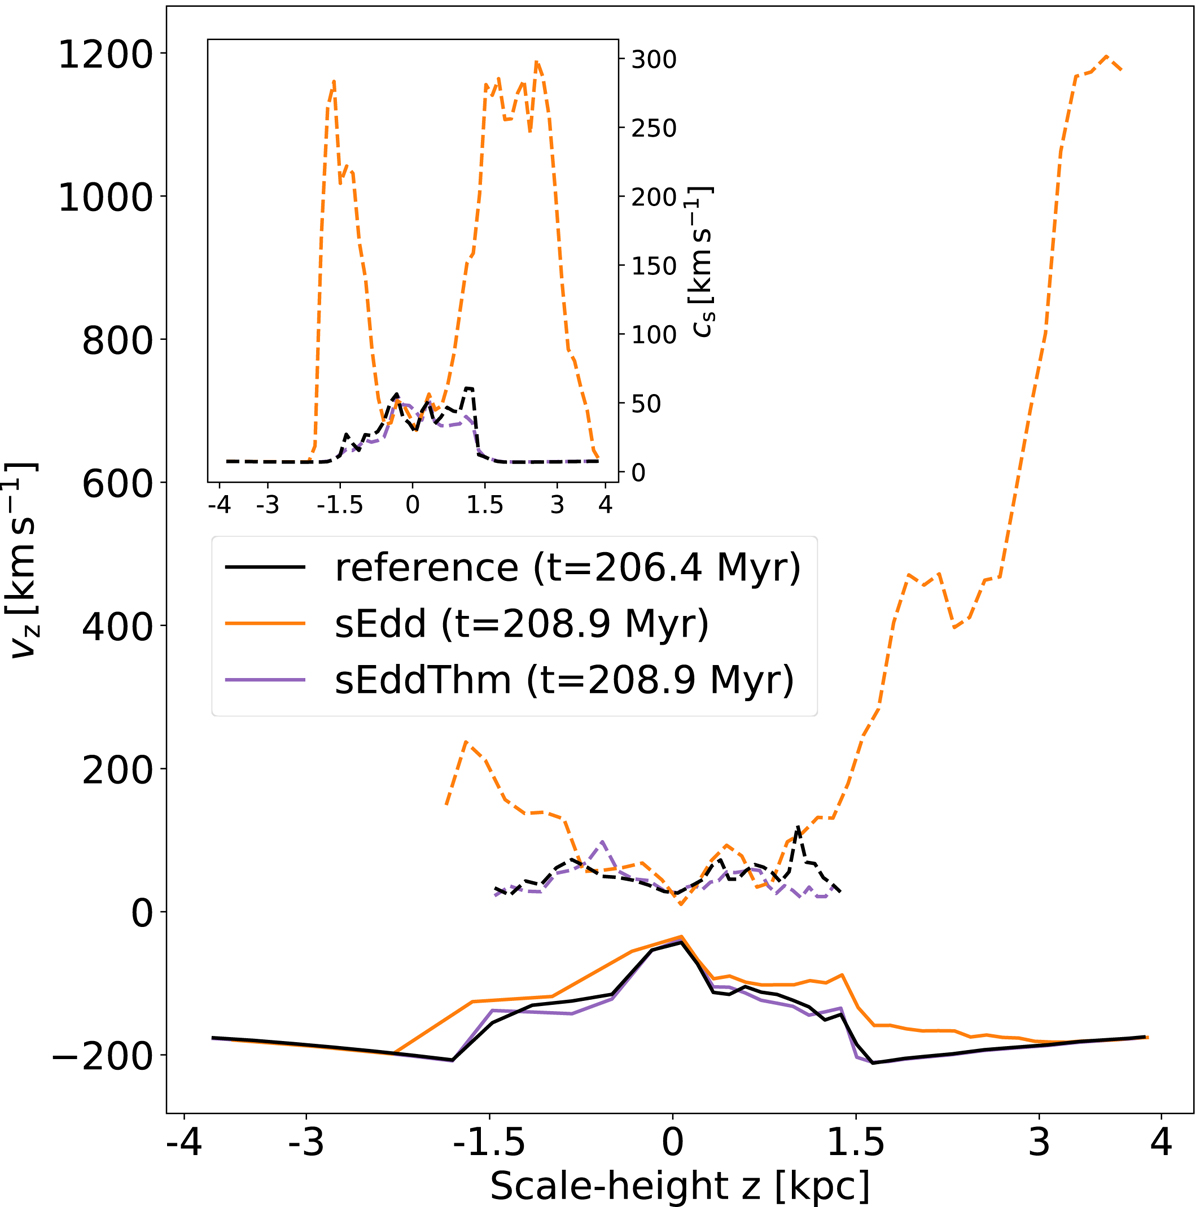
Evolution of the average z-velocity vz above and below the galaxy to follow the gas outflows (dashed) and inflows (solid) for both simulations at t = 208.9 Myr. A “reference” curve (black) is drawn to represent the state of the gas before the first super-Eddington episode, i.e. at t = 206.4 Myr. Kinetic jets are clearly visible as they impact gas that is far away from the galactic disc, heating it up on their way out. On the other hand, thermal feedback does not have enough momentum to have said impact.
Current usage metrics show cumulative count of Article Views (full-text article views including HTML views, PDF and ePub downloads, according to the available data) and Abstracts Views on Vision4Press platform.
Data correspond to usage on the plateform after 2015. The current usage metrics is available 48-96 hours after online publication and is updated daily on week days.
Initial download of the metrics may take a while.