Fig. 15.
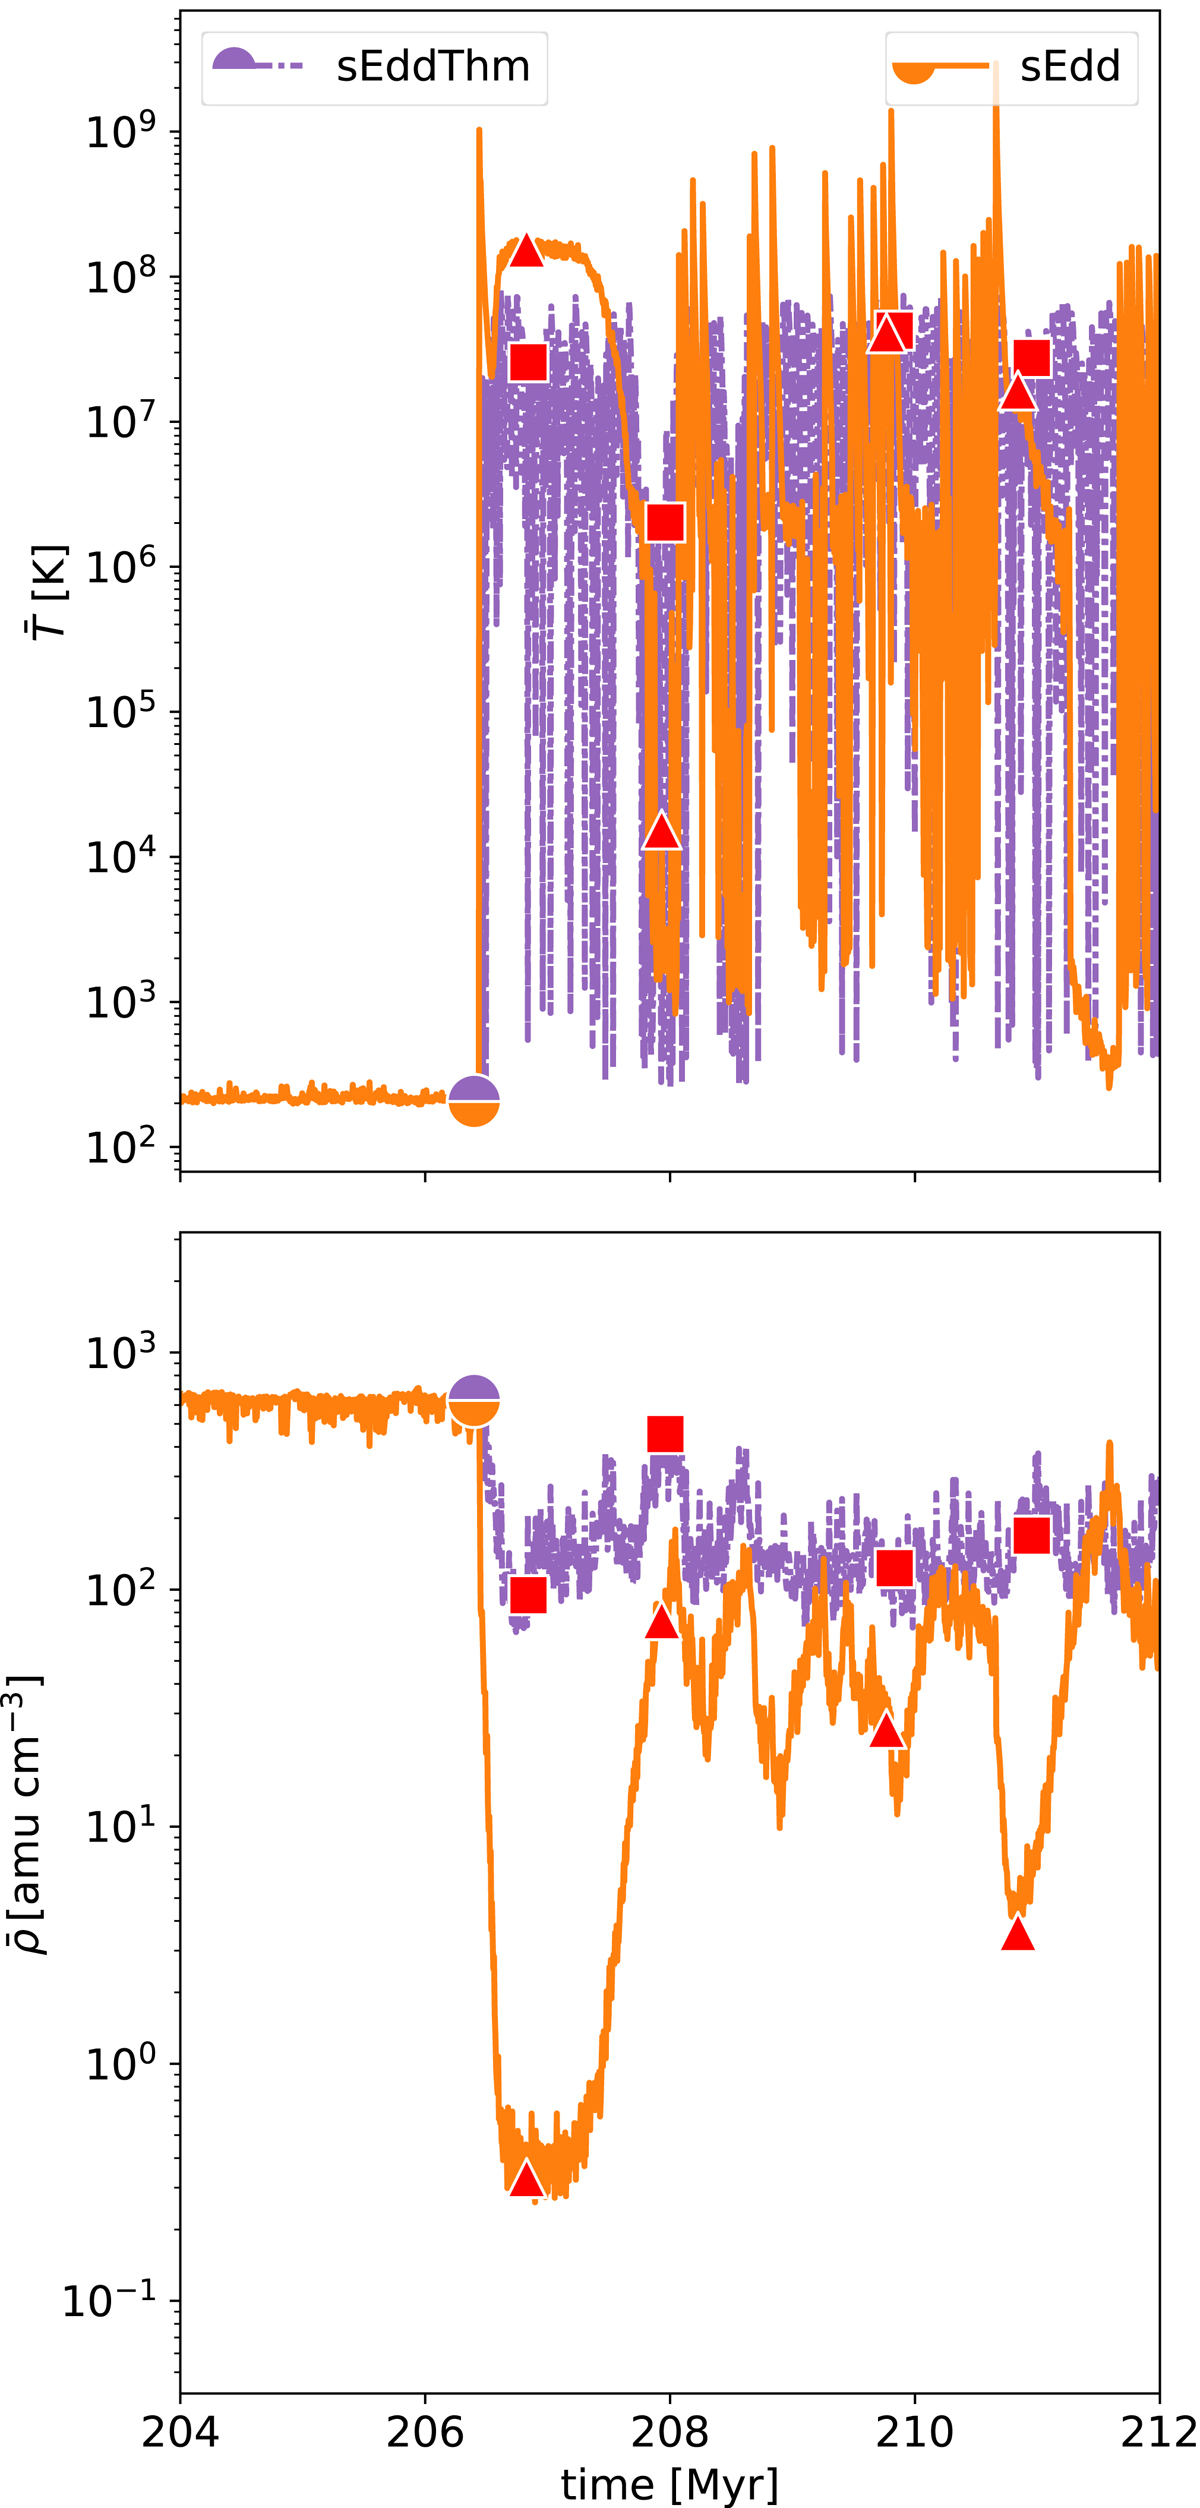
Download original image
Evolution of the average temperature (top) and density (bottom) around the BH in the accretion region for the ‘sEdd’ (solid orange) and ‘sEddThm’ (densely dash-dotted violet) simulations. The red triangles/squares correspond to the snapshots shown in Fig. 16 for the ‘sEdd’ and ‘sEddThm’ simulations respectively. As soon as strong super-Eddington events occur, a peak in temperature and a drop in gas density are observed. When kinetic feedback is involved, outflows are created by the momentum carried by the jet. But thanks to the rapid gas infall and refilling of the accretion region, the BH is able to go back in a super-Eddington phase within ≤1 Myr.
Current usage metrics show cumulative count of Article Views (full-text article views including HTML views, PDF and ePub downloads, according to the available data) and Abstracts Views on Vision4Press platform.
Data correspond to usage on the plateform after 2015. The current usage metrics is available 48-96 hours after online publication and is updated daily on week days.
Initial download of the metrics may take a while.