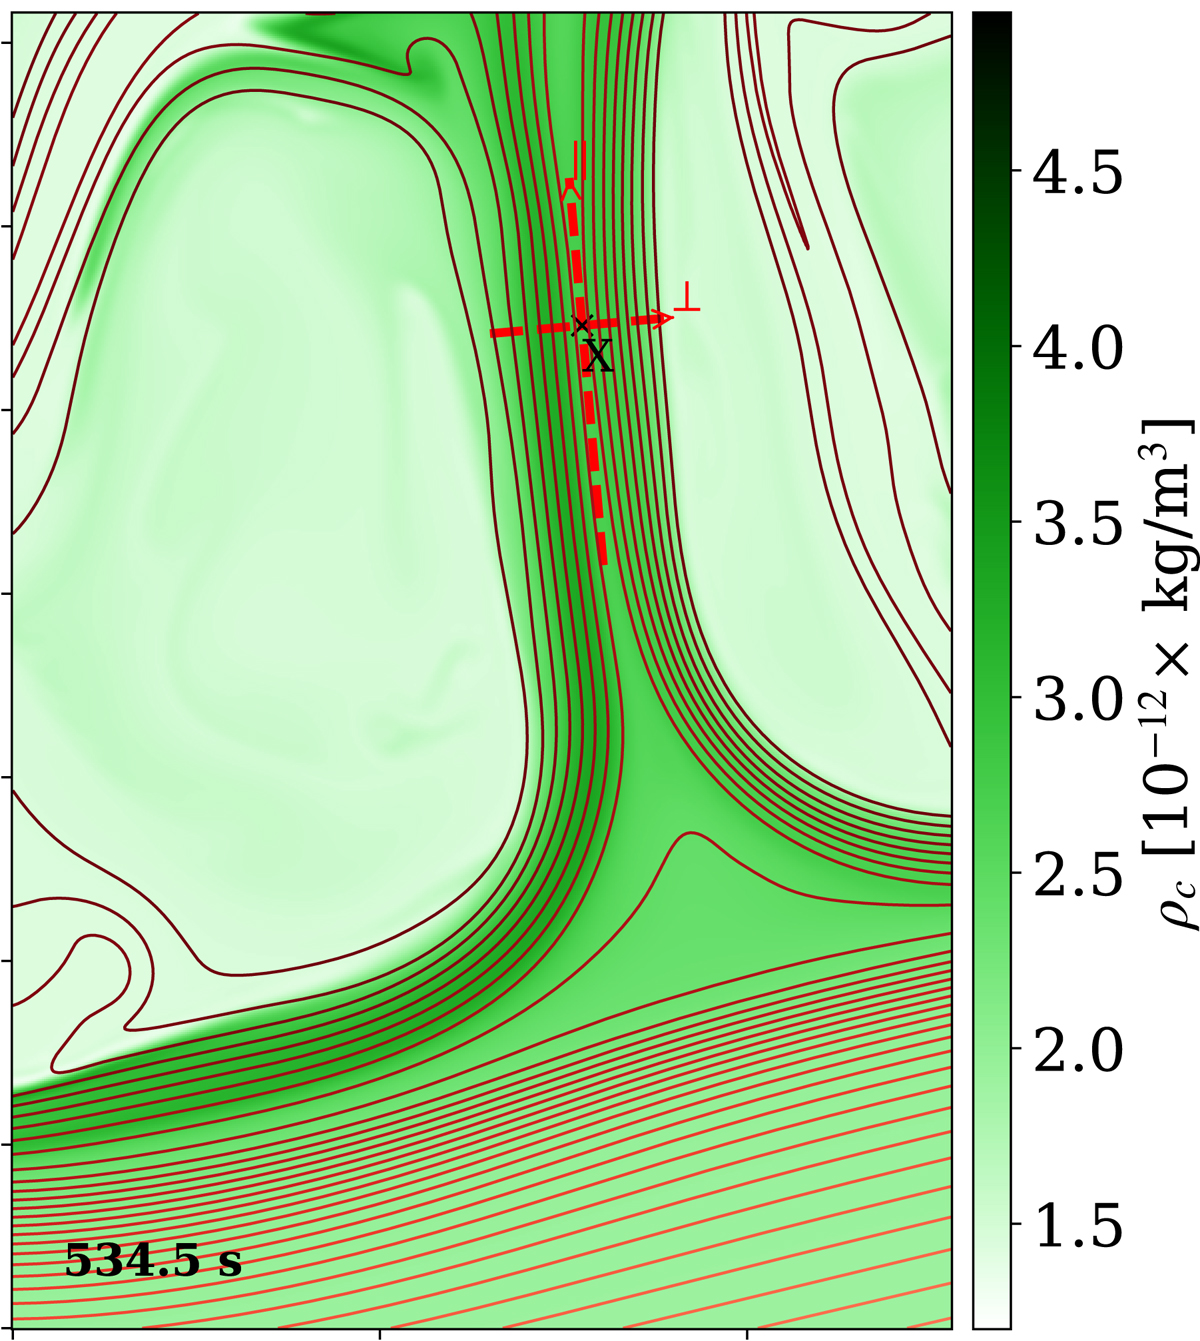
Fig. B.1.
Download original image
Snapshot of a reconnecting current sheet at t = 534.5 s with contours denoting in-plane projection of magnetic field lines, and a colormap of the density of the mass density of charges ρc. The snapshot window is the same as in Fig. 3. The center x-point of the current sheet determined as the location of the maximum out-of-plane current density Jy is marked with ‘X’ in the image. The dashed red line marks a cut along and across the current sheet in the direction parallel and perpendicular to the reconnecting magnetic field lines, respectively, as marked in the figure.
Current usage metrics show cumulative count of Article Views (full-text article views including HTML views, PDF and ePub downloads, according to the available data) and Abstracts Views on Vision4Press platform.
Data correspond to usage on the plateform after 2015. The current usage metrics is available 48-96 hours after online publication and is updated daily on week days.
Initial download of the metrics may take a while.