Fig. A.1.
Download original image
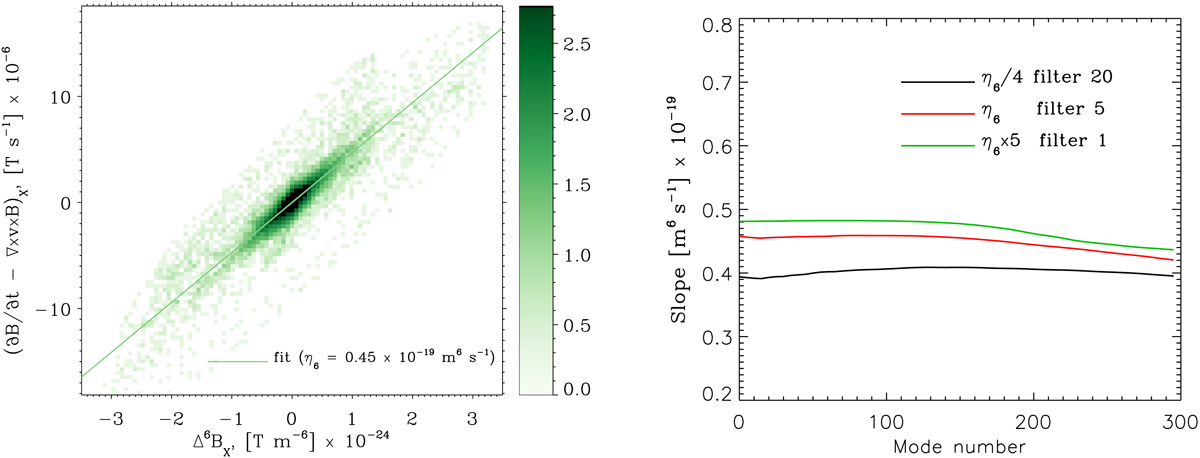
Fit of the sixth order numerical diffusivity coefficient ![]() . Left: Scatter plot showing the dependence between the terms of the induction equation, y = ∂B/∂t − ∇ × v × B (vertical axis) and s = Δ6B (horizontal axis). The intensity of the color indicated the number of spatial data points with the given values of (s,y) in log10 units. The green line shows the linear fit to the distribution, with the value of the slope
. Left: Scatter plot showing the dependence between the terms of the induction equation, y = ∂B/∂t − ∇ × v × B (vertical axis) and s = Δ6B (horizontal axis). The intensity of the color indicated the number of spatial data points with the given values of (s,y) in log10 units. The green line shows the linear fit to the distribution, with the value of the slope ![]() indicated in the figure. Right: Dependence of the slope
indicated in the figure. Right: Dependence of the slope ![]() on the spatial mode number, obtained after the fitting to the simulation data (as those from the left panel) for three simulations with different values of the filtering frequency: every 1 time step (green line), every 5 time steps (red line), and every 20 time steps (black line). The dependence on the mode number is obtained after applying a 2D Fourier high-pass filter to y = ∂B/∂t − ∇ × (v×B) and s = Δ6B variables in each case.
on the spatial mode number, obtained after the fitting to the simulation data (as those from the left panel) for three simulations with different values of the filtering frequency: every 1 time step (green line), every 5 time steps (red line), and every 20 time steps (black line). The dependence on the mode number is obtained after applying a 2D Fourier high-pass filter to y = ∂B/∂t − ∇ × (v×B) and s = Δ6B variables in each case.
Current usage metrics show cumulative count of Article Views (full-text article views including HTML views, PDF and ePub downloads, according to the available data) and Abstracts Views on Vision4Press platform.
Data correspond to usage on the plateform after 2015. The current usage metrics is available 48-96 hours after online publication and is updated daily on week days.
Initial download of the metrics may take a while.