Fig. 6.
Download original image
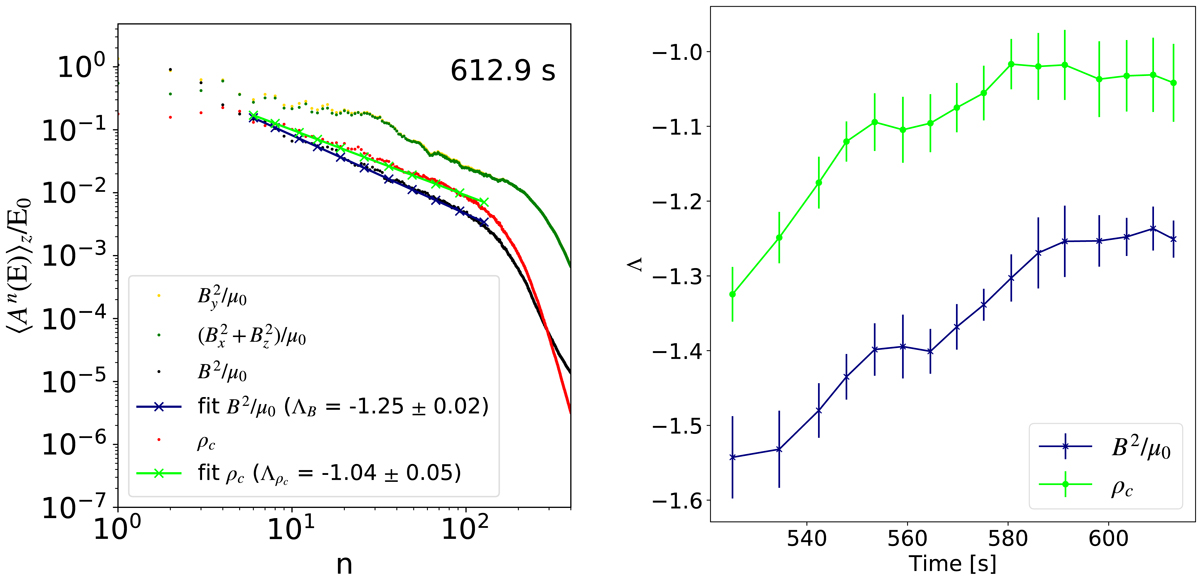
Fourier spectrum. Left: fourier decomposition of spatial structure in magnetic field and mass density of charges in the periodic x-direction at t = 612.9 s. For each horizontal mode, n, the amplitudes are calculated and averaged in height over the region of high RTI activity between z = −1.35 Mm and z = 0.65 Mm. Height-averaged Fourier decomposition amplitudes are shown for out-of-plane magnetic field, ![]() , in-plane magnetic field,
, in-plane magnetic field, ![]() , total magnetic field, B2/μ0, and mass density of charges, ρc. The normalization value (E0) used for magnetic field data is 10−3 J m−3 and for ρc is 10−12 kg m−3. The linear spectral fits ⟨An⟩z ∝ nΛ for (B2/μ0) and ρc are calculated using a subset of 11 mode amplitude values for n = [5, 7, 10, 13, 18, 25, 35, 48, 66, 91, 126] that are approximately equidistributed over the range of the fit in the log10n space, as illustrated with “x” markers in the panel. Right: time evolution of the spectral exponents. ΛB and Λρc, during the late non-linear and saturation phases of the RTI calculated at the same time instances as shown in the Fig. 3 snapshots. The errors of the fit are shown as vertical error bars.
, total magnetic field, B2/μ0, and mass density of charges, ρc. The normalization value (E0) used for magnetic field data is 10−3 J m−3 and for ρc is 10−12 kg m−3. The linear spectral fits ⟨An⟩z ∝ nΛ for (B2/μ0) and ρc are calculated using a subset of 11 mode amplitude values for n = [5, 7, 10, 13, 18, 25, 35, 48, 66, 91, 126] that are approximately equidistributed over the range of the fit in the log10n space, as illustrated with “x” markers in the panel. Right: time evolution of the spectral exponents. ΛB and Λρc, during the late non-linear and saturation phases of the RTI calculated at the same time instances as shown in the Fig. 3 snapshots. The errors of the fit are shown as vertical error bars.
Current usage metrics show cumulative count of Article Views (full-text article views including HTML views, PDF and ePub downloads, according to the available data) and Abstracts Views on Vision4Press platform.
Data correspond to usage on the plateform after 2015. The current usage metrics is available 48-96 hours after online publication and is updated daily on week days.
Initial download of the metrics may take a while.