Fig. 5.
Download original image
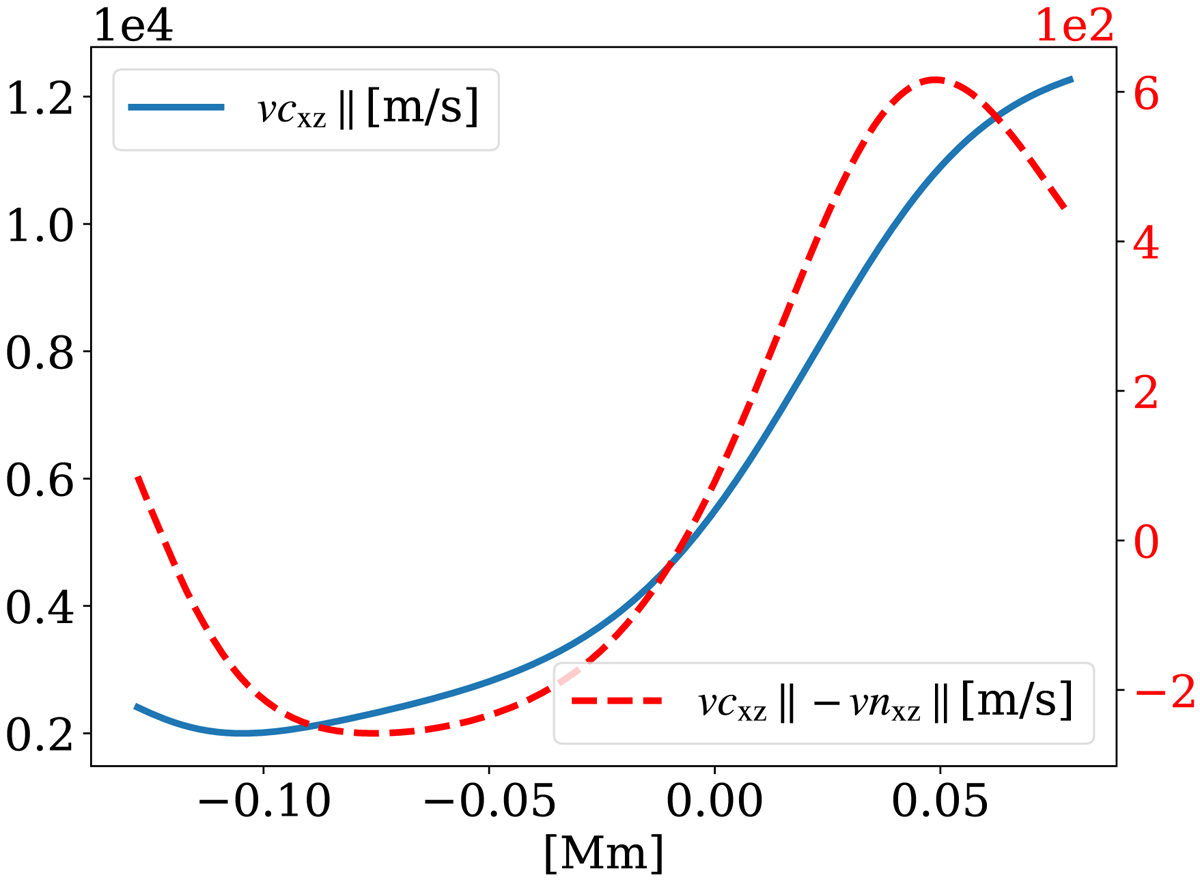
Outflow profiles along the reconnecting current sheet, the direction indicated by “∥” in Fig. B.1 at time t = 534.5 s. Blue solid line is for the charged velocity with values indicated at the left axis, red dashed line is for the decoupling velocity, with values indicated at the right axis. The location of 0 on the x-axis corresponds to the location the points marked by “X” along the current sheet in Fig. B.1.
Current usage metrics show cumulative count of Article Views (full-text article views including HTML views, PDF and ePub downloads, according to the available data) and Abstracts Views on Vision4Press platform.
Data correspond to usage on the plateform after 2015. The current usage metrics is available 48-96 hours after online publication and is updated daily on week days.
Initial download of the metrics may take a while.