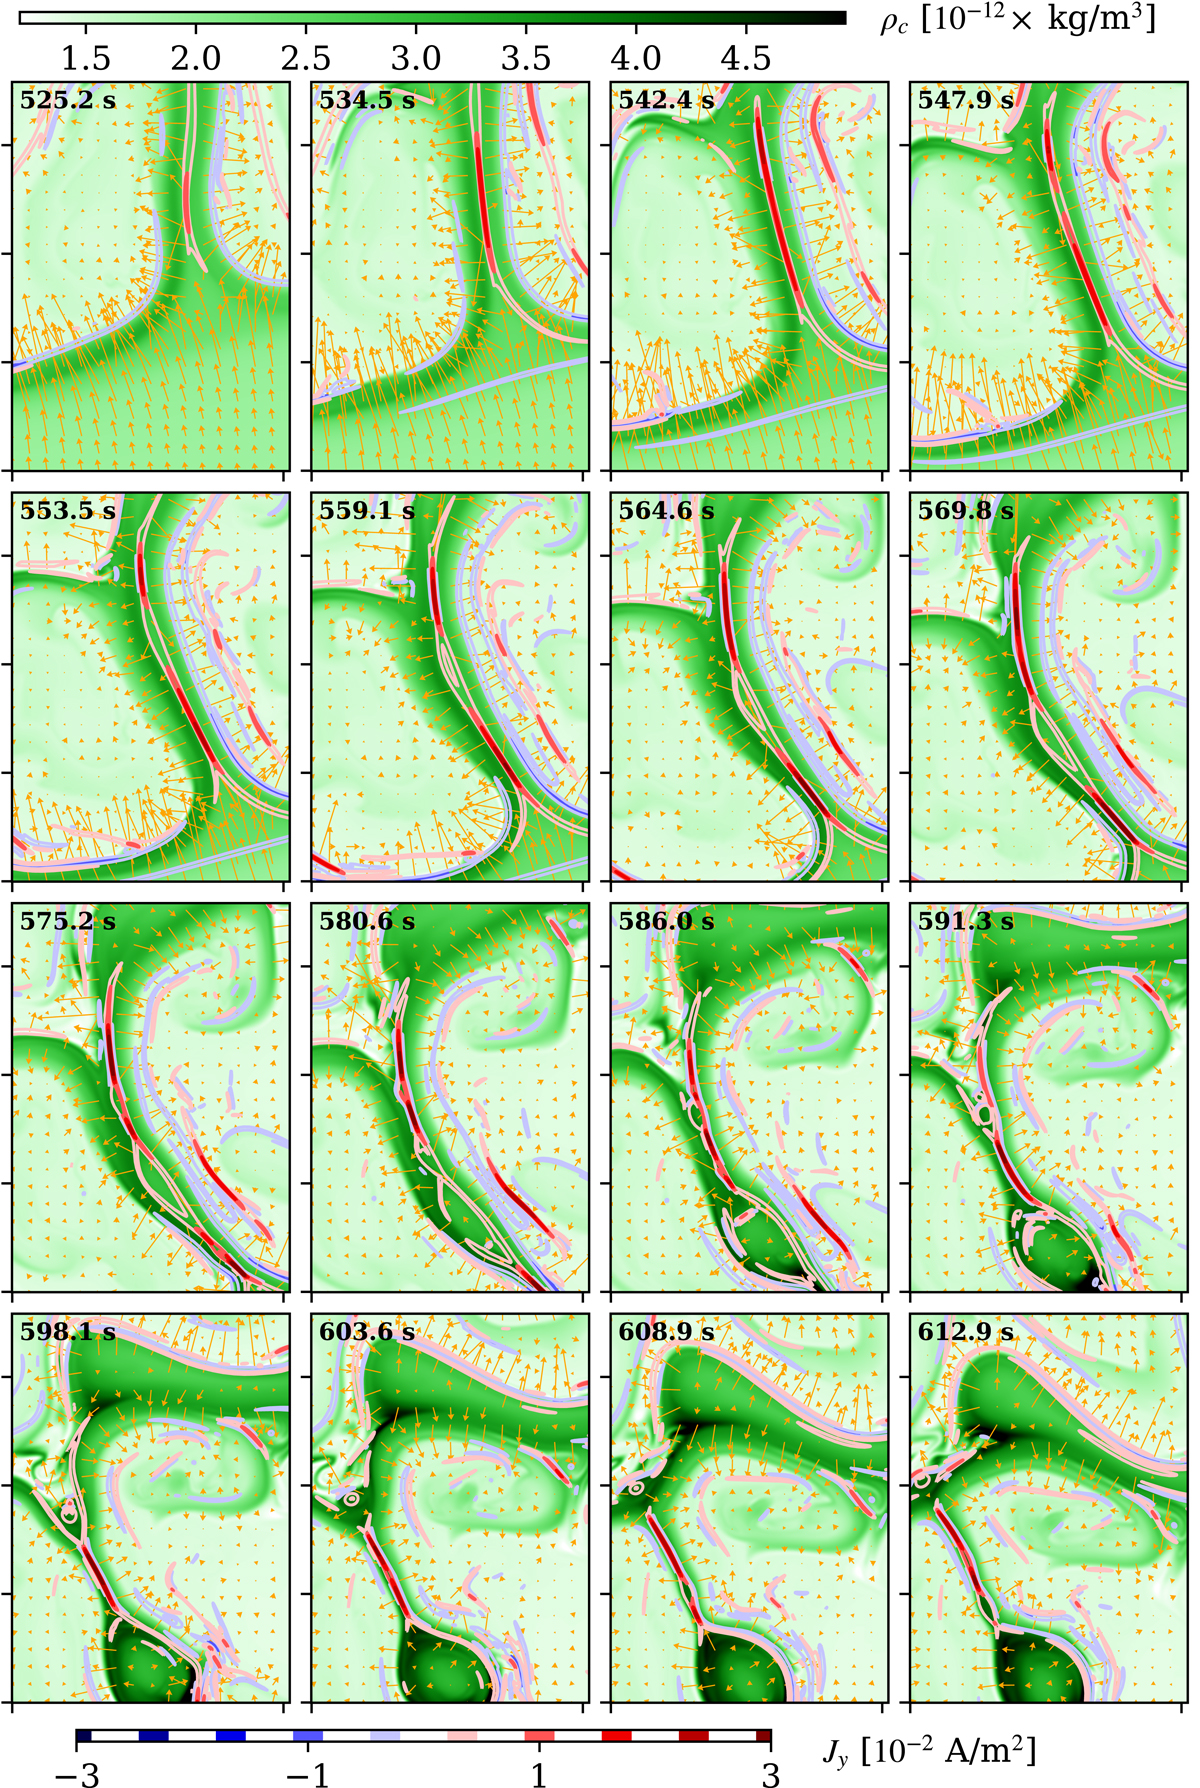
Fig. 3.
Download original image
Snapshot sequence of dynamic evolution of a reconnecting current layer with recurring plasmoid formation is shown with color contours of the out-of-plane current density Jy and arrows showing difference in the in-plane flow between charges and neutrals (vc − vn)xz plotted over a colormap of the mass density of charges. The snapshot window is illustrated in the t = 534.5 s panels of Fig. 1 and has coordinates (x, z)∈[−0.4 Mm, 0.1 Mm]×[−1.4 Mm, − 0.7 Mm]. An arrow with length of 50 km corresponds to a speed difference of |(vc − vn)xz|=128 m s−1.
Current usage metrics show cumulative count of Article Views (full-text article views including HTML views, PDF and ePub downloads, according to the available data) and Abstracts Views on Vision4Press platform.
Data correspond to usage on the plateform after 2015. The current usage metrics is available 48-96 hours after online publication and is updated daily on week days.
Initial download of the metrics may take a while.