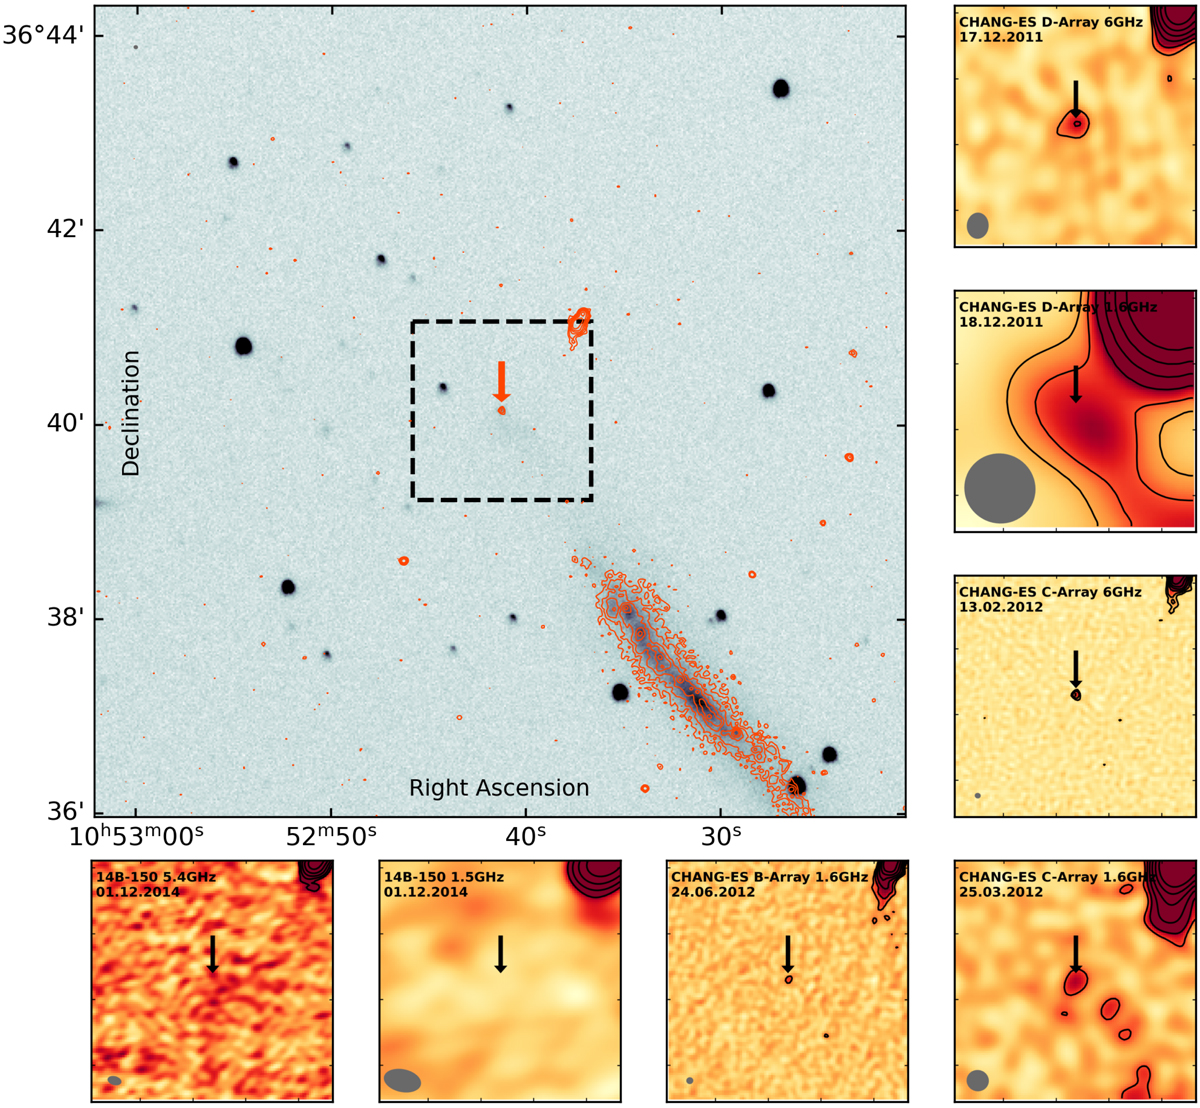
Fig. 8.
Download original image
Detections and examples of nondetections of AT 2000ch in radio continuum data. The large panel shows the complete ZTF r-Band frame (500″ × 500″). The red and black arrows point to the position of AT 2000ch: RA = 10h52m41.256s Dec = +36° 40′08.95″. Small panels show 110″ × 110″ cutouts (indicated as black box in the large panel) of radio maps listed in Table 1 (CHANG-ES and 14B-150). As listed in Table 1, we report detections in the CHANG-ES D-array C-Band maps, C-array C-Band and L-Band maps, and B-array L-Band maps.
Current usage metrics show cumulative count of Article Views (full-text article views including HTML views, PDF and ePub downloads, according to the available data) and Abstracts Views on Vision4Press platform.
Data correspond to usage on the plateform after 2015. The current usage metrics is available 48-96 hours after online publication and is updated daily on week days.
Initial download of the metrics may take a while.