Fig. 6.
Download original image
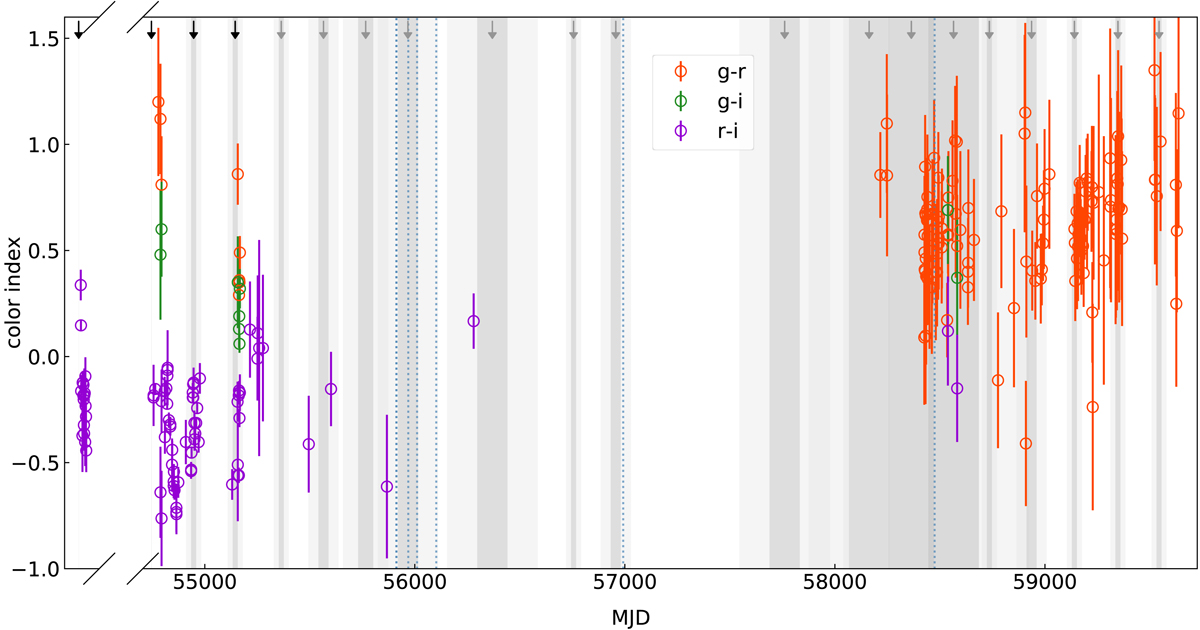
Full color evolution of AT 2000ch in g − r (orange), g − i (green), and r − i (purple). Previously published color values by Wagner et al. (2004), Pastorello et al. (2010), and Pastorello et al. (2013) (converted to the Sloan photometric system) are shown as well as our photometric results from the PTF/ZTF survey observations. We only show the previously published data points for those color indices where we have added new observations. The vertical blue dotted lines indicate the dates of the observations that we collected in the radio range and the arrows mark the times of known (black) and newly detected or suspected (gray) eruptive episodes based on Eq. (1) with their 1σ (3σ) uncertainty indicated by the gray (light gray) shaded areas.
Current usage metrics show cumulative count of Article Views (full-text article views including HTML views, PDF and ePub downloads, according to the available data) and Abstracts Views on Vision4Press platform.
Data correspond to usage on the plateform after 2015. The current usage metrics is available 48-96 hours after online publication and is updated daily on week days.
Initial download of the metrics may take a while.