Fig. 3.
Download original image
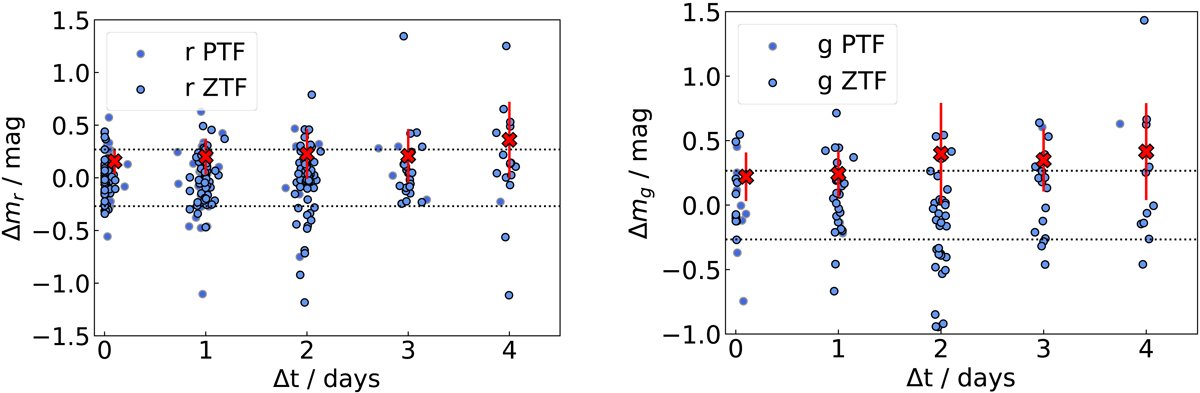
Difference in brightness Δm between consecutive PTF/ZTF measurements in the same filter as a function of the elapsed time between them Δt for r and g. The dotted lines mark ![]() median photometric error in the corresponding filter. Red crosses mark the mean absolute deviation and the red error bar shows the standard deviation of absolute difference in brightness for each cluster of data points.
median photometric error in the corresponding filter. Red crosses mark the mean absolute deviation and the red error bar shows the standard deviation of absolute difference in brightness for each cluster of data points.
Current usage metrics show cumulative count of Article Views (full-text article views including HTML views, PDF and ePub downloads, according to the available data) and Abstracts Views on Vision4Press platform.
Data correspond to usage on the plateform after 2015. The current usage metrics is available 48-96 hours after online publication and is updated daily on week days.
Initial download of the metrics may take a while.