Fig. 2.
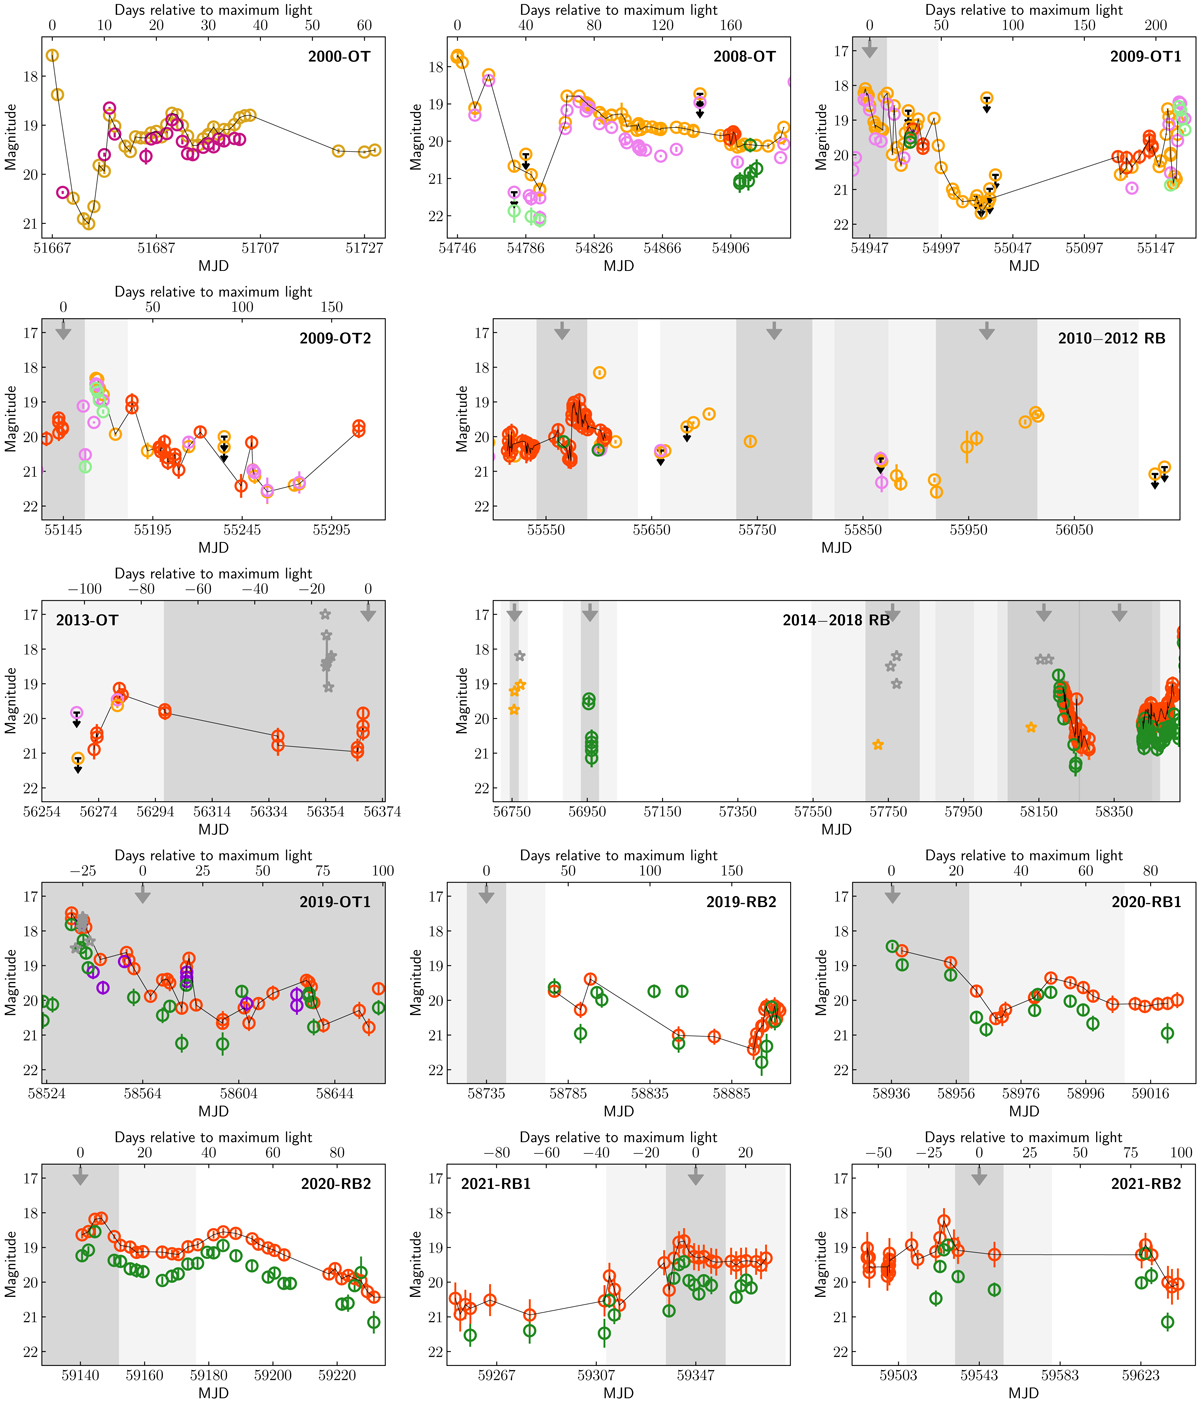
Download original image
Cutouts of the optical light curve presented in Fig. 1. Each subplot presents a set of consecutive measurements of an epoch of AT 2000ch, and the corresponding names of the outbursts described throughout the text are given in the top of each subplot. Each outburst is located at day 0 while newly detected or suspected (gray arrow) eruptive episodes or re-brightening events based on Eq. (1) with their 1σ (3σ) uncertainty indicated by the gray (light gray) shaded areas are additionally highlighted. The color code of each data point follows the legend shown in Fig. 1. We additionally show the less sampled brightness variation of the source between 2010 and 2012 as well as 2014 and 2018, which does not disagree with a ∼201 day period, even though the source seems to have undergone a more quiet phase (no reported outbursts).
Current usage metrics show cumulative count of Article Views (full-text article views including HTML views, PDF and ePub downloads, according to the available data) and Abstracts Views on Vision4Press platform.
Data correspond to usage on the plateform after 2015. The current usage metrics is available 48-96 hours after online publication and is updated daily on week days.
Initial download of the metrics may take a while.