Fig. 8
Download original image
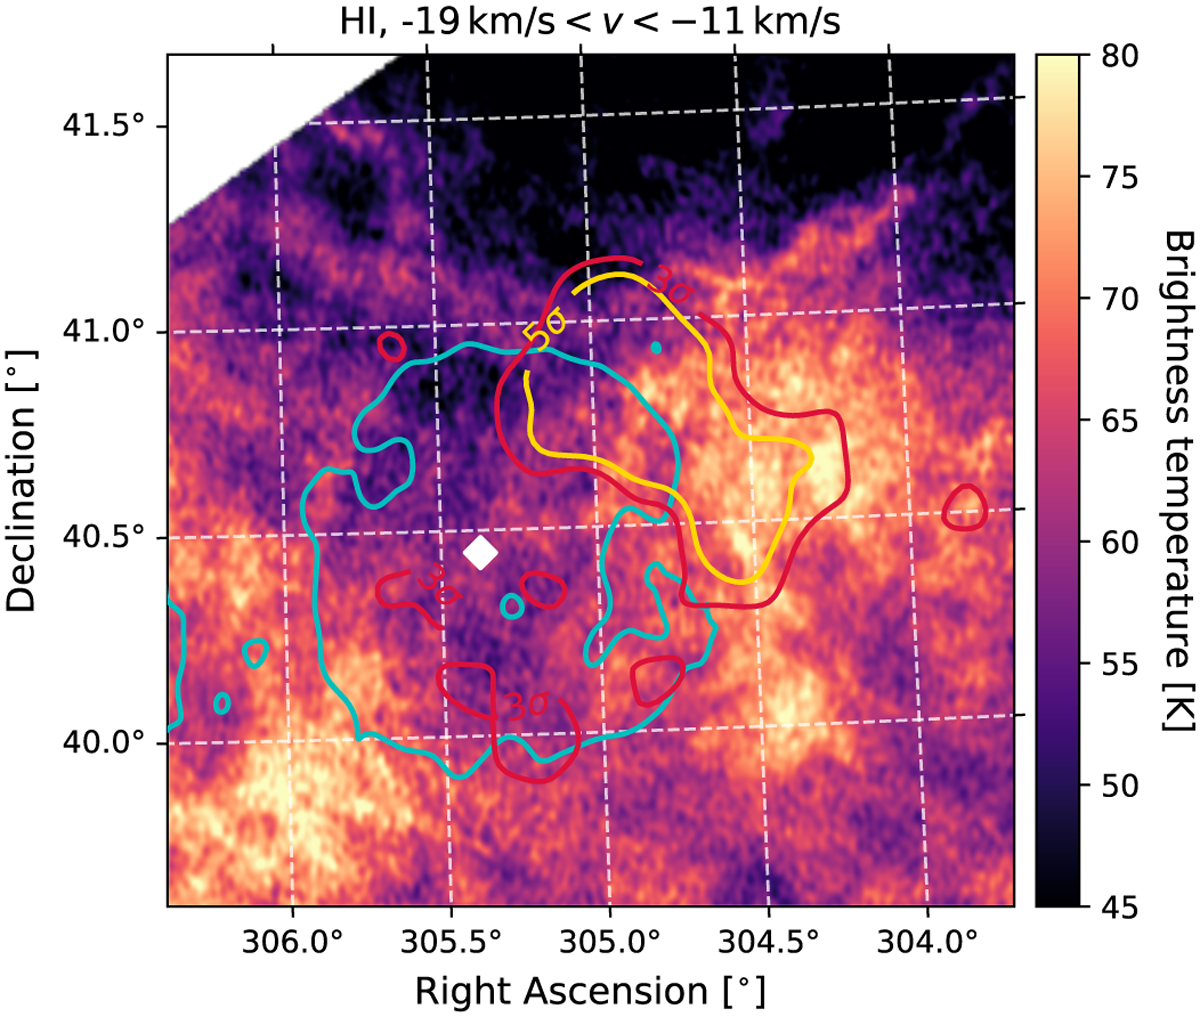
HI emission at velocities between −19 km s−1 and −11 km s−1 measured by the CGPS. The red and yellow lines show the 3 σ and 5 σ significance contours of the γ-ray emission observed by MAGIC (Fig. 1). The cyan lines are the 400 K contours of the 408 MHz continuum emission from the CGPS. The white diamond gives the position of PSRJ2021+4026.
Current usage metrics show cumulative count of Article Views (full-text article views including HTML views, PDF and ePub downloads, according to the available data) and Abstracts Views on Vision4Press platform.
Data correspond to usage on the plateform after 2015. The current usage metrics is available 48-96 hours after online publication and is updated daily on week days.
Initial download of the metrics may take a while.