Free Access
Fig. 7
Download original image
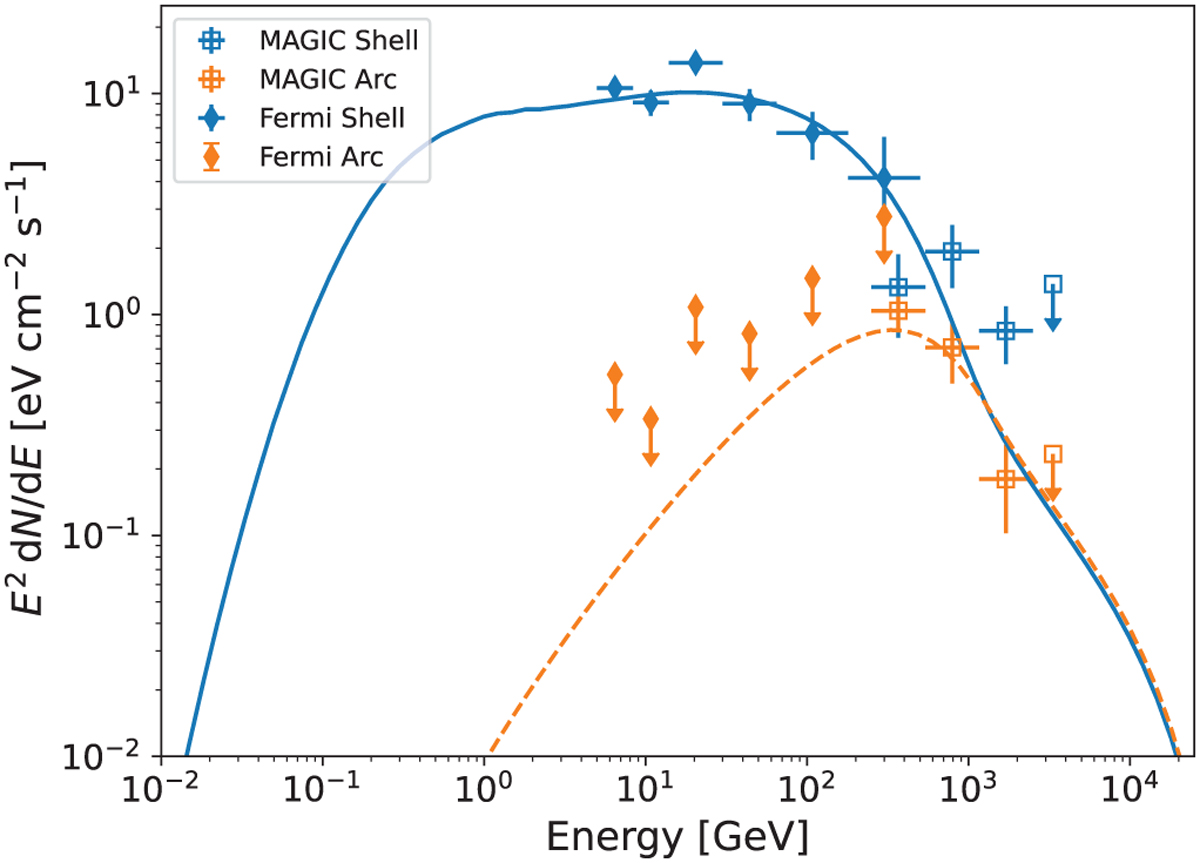
Computed γ-ray flux due to π0 decay from the SNR interior (blue solid line) and from the arc region (orange dashed line) based on our model compared against data points from our Fermi-LAT (diamonds) and MAGIC (squares) analysis.
Current usage metrics show cumulative count of Article Views (full-text article views including HTML views, PDF and ePub downloads, according to the available data) and Abstracts Views on Vision4Press platform.
Data correspond to usage on the plateform after 2015. The current usage metrics is available 48-96 hours after online publication and is updated daily on week days.
Initial download of the metrics may take a while.