Fig. 2
Download original image
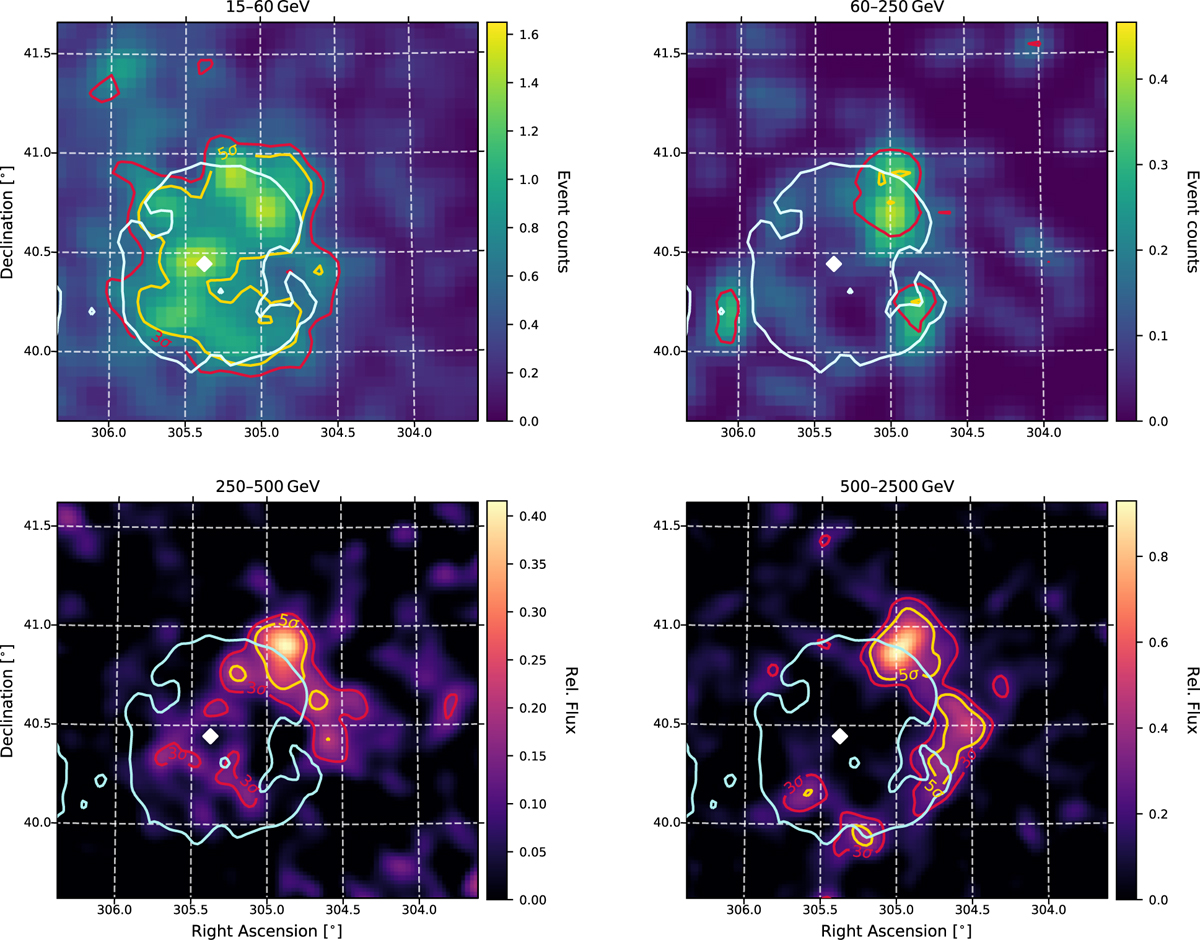
Energy-dependent morphology of the γ Cygni SNR. Upper left: Fermi-LAT count map between 15 and 60 GeV smoothed with a Gaussian kernel (σ = 0°.75) and 3 σ and 5 σ contours of a point source search. The white line is the 400 K contour of the 408 MHz observation by the CGPS. The white diamond identifies the position of PSR 2021+4026. Upper right: same as upper left, but in the range from 60 to 250 GeV. Lower left: Relative flux map observed by MAGIC at 250–500 GeV together with 3 σ and 5 σ point source significance contours. The same radio contours as in upper panels are displayed in cyan. Lower right: same as lower left, but in the energy range from 500 GeV to 2.5 TeV.
Current usage metrics show cumulative count of Article Views (full-text article views including HTML views, PDF and ePub downloads, according to the available data) and Abstracts Views on Vision4Press platform.
Data correspond to usage on the plateform after 2015. The current usage metrics is available 48-96 hours after online publication and is updated daily on week days.
Initial download of the metrics may take a while.