Fig. 10
Download original image
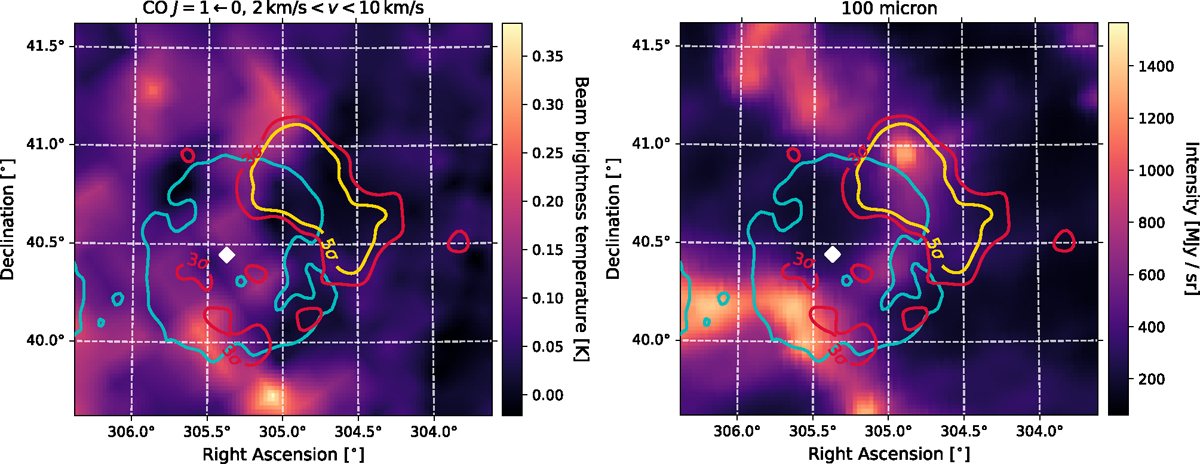
Left: Average of CO J = 1 ← 0 emission between 2 km s−1 and 10 km s−1 based on data from Leung & Thaddeus (1992) interpolated on the coordinate grid of the MAGIC data. The cyan contours are the 400 K contour of the 408 MHz observation by the CGPS and the red and yellow contours are the 3 σ and 5 σ significance contours of the emission seen by MAGIC. The white diamond gives the position of the PSR J2021+4026. Right: 100 µm intensity map based on data from Schlegel et al. (1998) interpolated on the coordinate grid of the MAGIC data. Contours and symbol are the same as in the left panel.
Current usage metrics show cumulative count of Article Views (full-text article views including HTML views, PDF and ePub downloads, according to the available data) and Abstracts Views on Vision4Press platform.
Data correspond to usage on the plateform after 2015. The current usage metrics is available 48-96 hours after online publication and is updated daily on week days.
Initial download of the metrics may take a while.