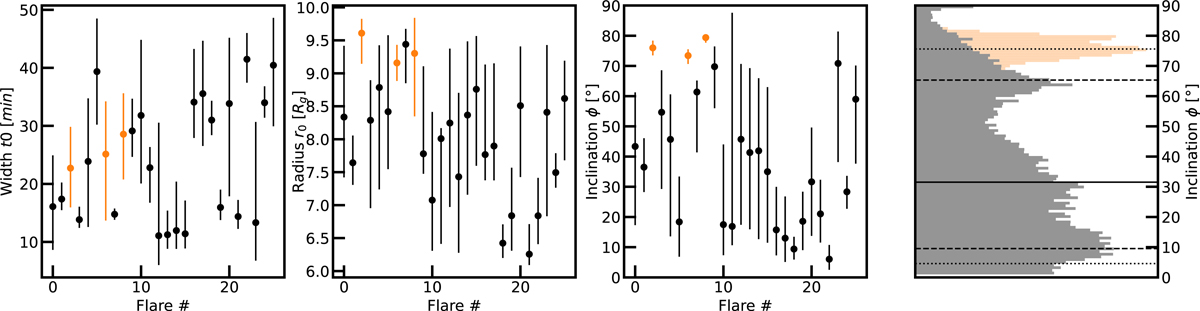
Fig. 8.
Download original image
Fit results of the 25 individual flares. The three left plots show the mean and 1σ values of the posterior of the respective fits. The three points highlighted in orange show flares that are inconsistent with a low inclination (i). The rightmost plot shows the histograms of the stacked posterior samples, both excluding the three high inclination flares (in gray) and including them (in orange).
Current usage metrics show cumulative count of Article Views (full-text article views including HTML views, PDF and ePub downloads, according to the available data) and Abstracts Views on Vision4Press platform.
Data correspond to usage on the plateform after 2015. The current usage metrics is available 48-96 hours after online publication and is updated daily on week days.
Initial download of the metrics may take a while.