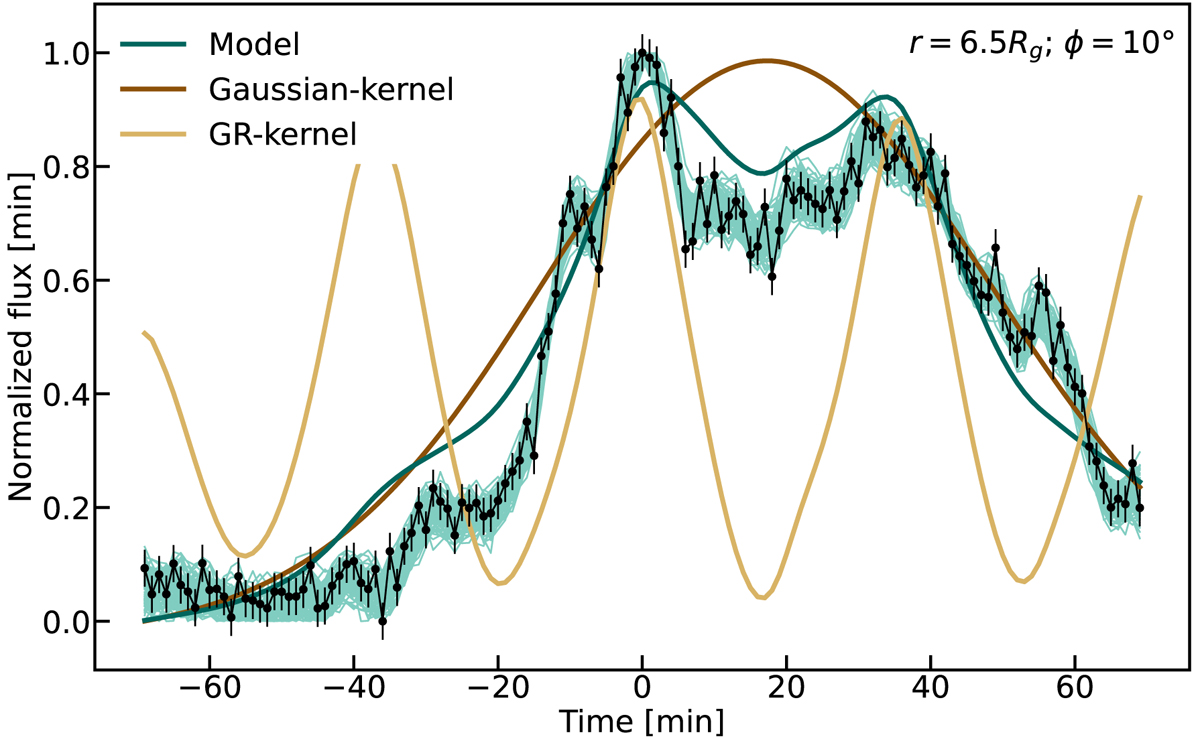
Fig. 7.
Download original image
Example of a flare fit with a well-determined width (t0), radial separation (r0), and inclination (ϕ). We plot the average of 100 model light curves drawn from the posterior. To make all model components comparable, the fluxes have been normalized. The light yellow line shows the averaged relativistic kernel, dark brown shows the averaged Gaussian flare kernel, dark green shows the composite model without the Gaussian process component, and light green shows the 100 realizations of the full model.
Current usage metrics show cumulative count of Article Views (full-text article views including HTML views, PDF and ePub downloads, according to the available data) and Abstracts Views on Vision4Press platform.
Data correspond to usage on the plateform after 2015. The current usage metrics is available 48-96 hours after online publication and is updated daily on week days.
Initial download of the metrics may take a while.