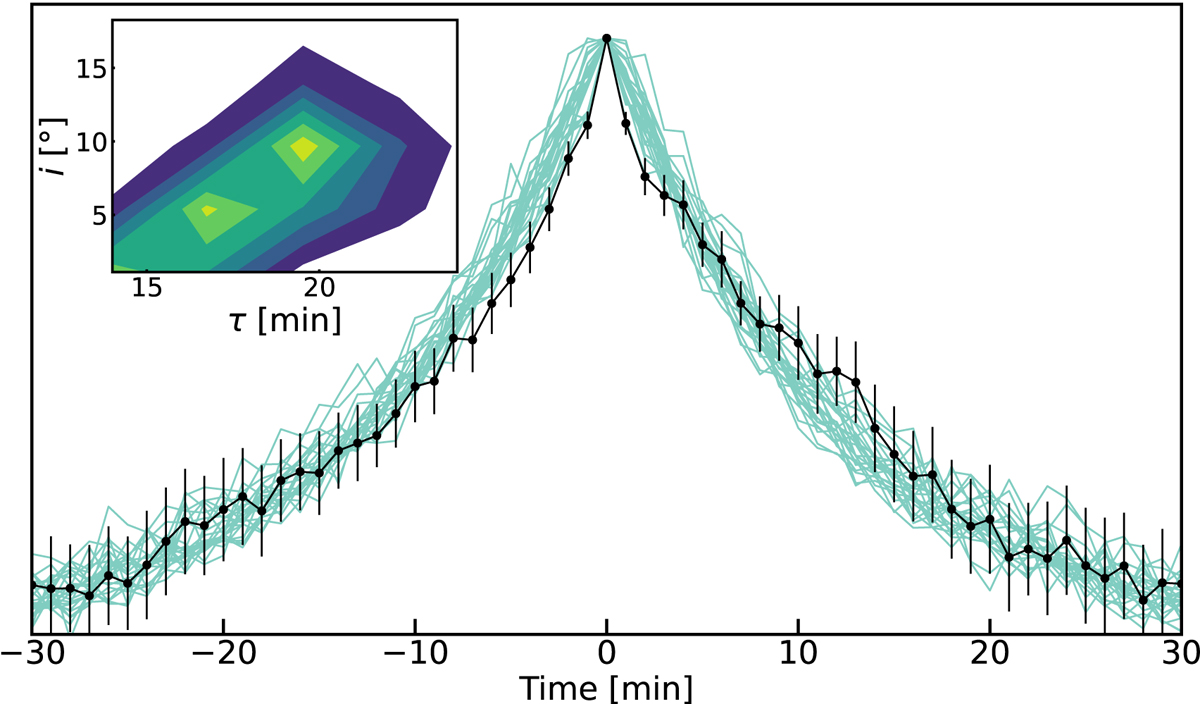
Fig. 5.
Download original image
Model PCA components calculated from the posterior samples derived from the flare empirical model (light green) and fit to the observed PCA (black points and line). The errors are determined from the standard deviation of the bootstrap sample (see the text for details). The inset shows the posterior of the observer inclination and intrinsic timescale (see Sect. 3.3 for details and caveats).
Current usage metrics show cumulative count of Article Views (full-text article views including HTML views, PDF and ePub downloads, according to the available data) and Abstracts Views on Vision4Press platform.
Data correspond to usage on the plateform after 2015. The current usage metrics is available 48-96 hours after online publication and is updated daily on week days.
Initial download of the metrics may take a while.