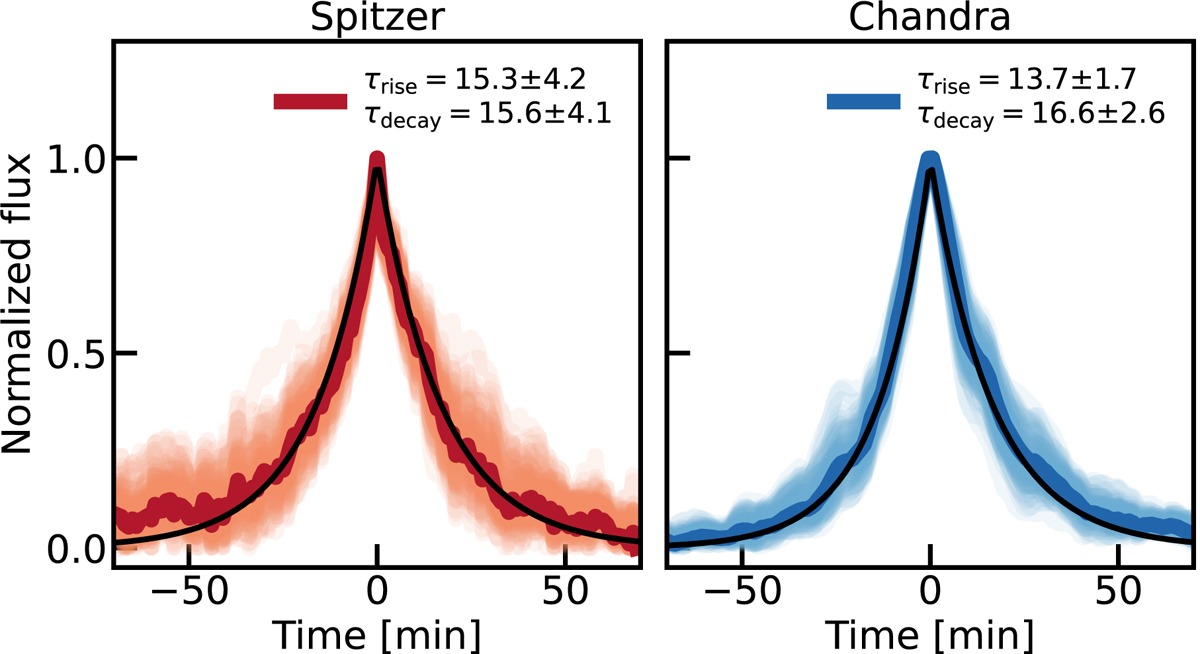
Fig. 4.
Download original image
Exponential rise and decay time of the characteristic flare shape. Left: principal component derived from the Spitzer data. The light red lines show the first components derived from 100 bootstrapped flare data sets. The black line shows the best fit exponential rise and decay. The uncertainty denoted in the figure legend is derived from the standard deviation of the τ value in the bootstrap samples. Right: same but for the Chandra X-ray data.
Current usage metrics show cumulative count of Article Views (full-text article views including HTML views, PDF and ePub downloads, according to the available data) and Abstracts Views on Vision4Press platform.
Data correspond to usage on the plateform after 2015. The current usage metrics is available 48-96 hours after online publication and is updated daily on week days.
Initial download of the metrics may take a while.