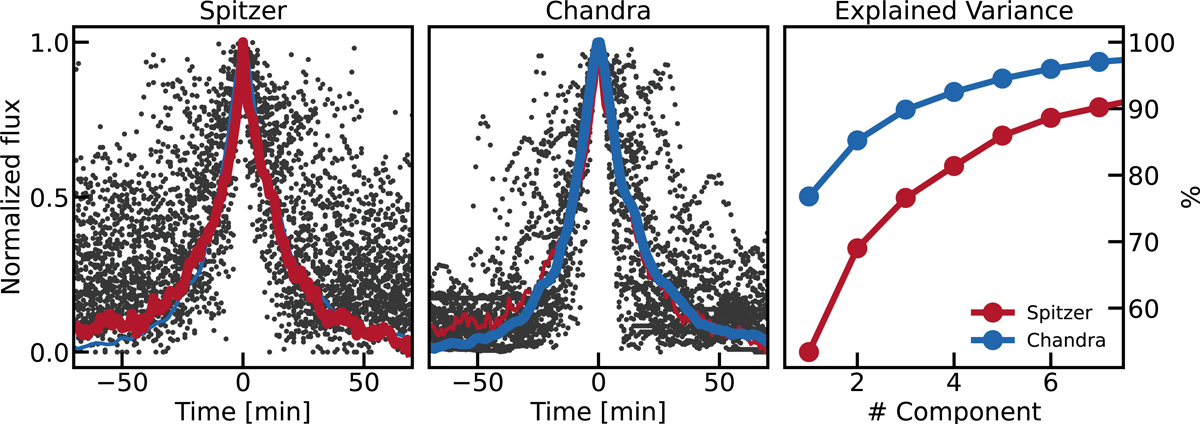
Fig. 2.
Download original image
Characteristic flare shape of NIR and X-ray flares. Left: normalized data segments for the 25 flares highlighted in Fig. 1. The thick red line indicates the first principal component derived from the data and the thin blue line the first principal component derived from the X-ray Chandra data (see the middle panel). Middle: same as the left panel for the 26 Chandra X-ray flares. Right: explained cumulative variance of the PCA components of Spitzer (red) and Chandra data (blue).
Current usage metrics show cumulative count of Article Views (full-text article views including HTML views, PDF and ePub downloads, according to the available data) and Abstracts Views on Vision4Press platform.
Data correspond to usage on the plateform after 2015. The current usage metrics is available 48-96 hours after online publication and is updated daily on week days.
Initial download of the metrics may take a while.