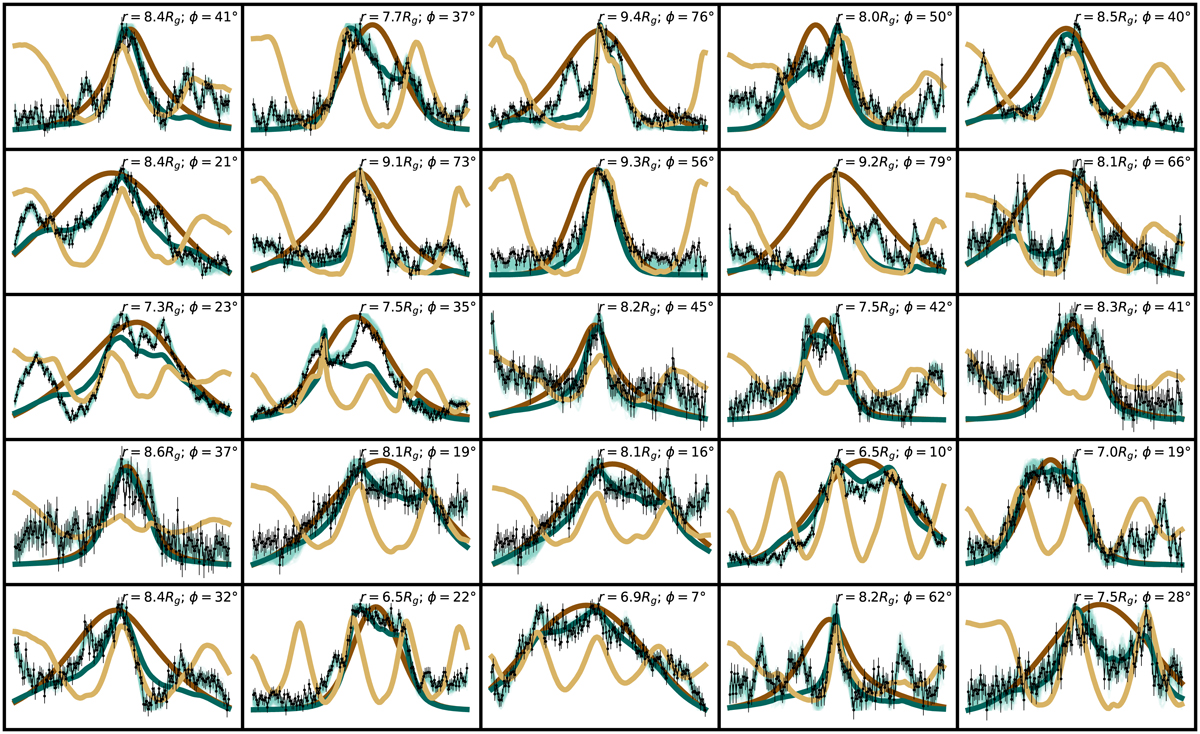
Fig. D.1.
Download original image
Flares and posterior samples of the orbiting hot-spot model. This figure is similar to Figure 7, but shows the fits to all 24 flares. The models shown are not the best fit but rather the average of 100 models drawn from the posterior. This illustrates features of the multimodal posteriors. The light yellow line shows the averaged relativistic kernel, the dark brown shows the averaged Gaussian flare kernel, the dark green shows the composite model without the Gaussian process component, and the light green shows the full model. The annotated values of ϕ and r0 are median posterior values.
Current usage metrics show cumulative count of Article Views (full-text article views including HTML views, PDF and ePub downloads, according to the available data) and Abstracts Views on Vision4Press platform.
Data correspond to usage on the plateform after 2015. The current usage metrics is available 48-96 hours after online publication and is updated daily on week days.
Initial download of the metrics may take a while.