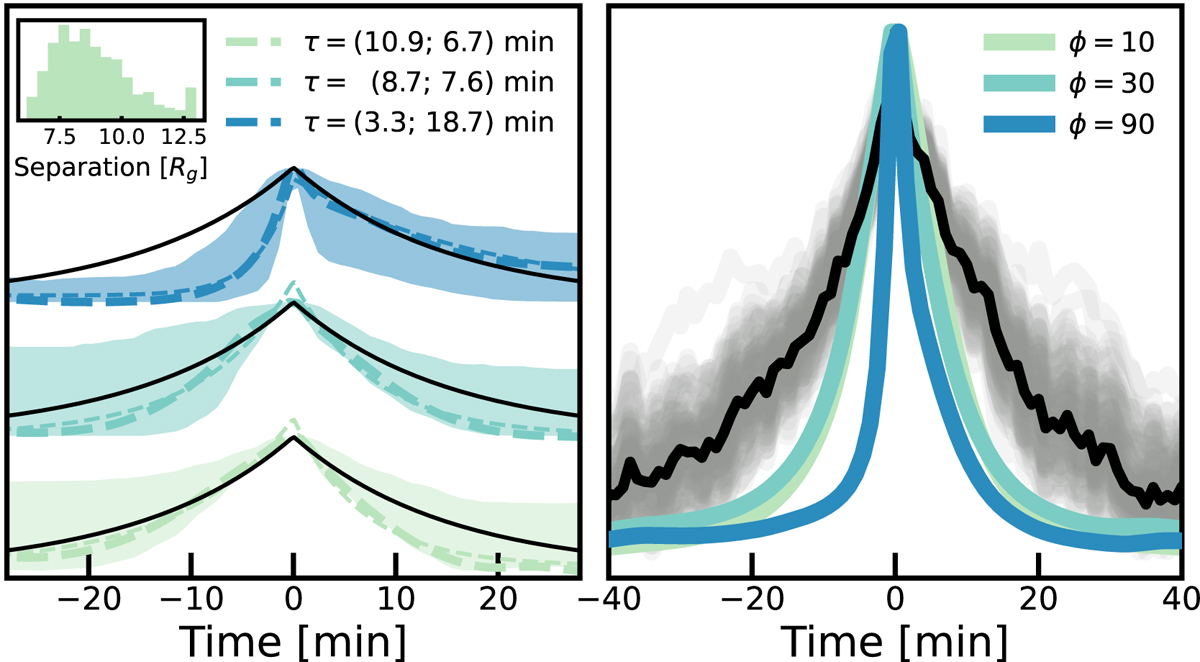
Fig. C.1.
Download original image
Extreme cases of the orbiting hot-spot model: purely exponential and purely constant intrinsic emission. Left: Extreme case of flares simulated with a constant intrinsic emission modulated by relativistic effects. We plot the 1σ envelope of the principal component fitted to 1000 flare simulations (see the text for details). Three simulations are plotted, shifted by a constant amount to make them comparable. The bottom envelope shows the i = 10° case, the middle envelope the i = 50° case, and the top envelope the i = 90° case. The figure inset shows the histogram of orbital separation used in the simulation. The legend gives the best fit rise and decay times of the exponential functions (thin dashed lines) fitted to the PCA component of the data (thick dashed). The black line shows the best fit exponential derived from the Spitzer data. Right: Extreme case of flares simulated with an intrinsic exponential flare shape with a rise and decay time of τ = 15 min, modulated by relativistic effects. Again, three scenarios for inclinations i = 10, i = 50, and i = 90 are shown. The thick black line shows the PCA component derived from the Spitzer data, and the thin gray lines show the bootstrapped surrogates, as in Figure 4.
Current usage metrics show cumulative count of Article Views (full-text article views including HTML views, PDF and ePub downloads, according to the available data) and Abstracts Views on Vision4Press platform.
Data correspond to usage on the plateform after 2015. The current usage metrics is available 48-96 hours after online publication and is updated daily on week days.
Initial download of the metrics may take a while.