Fig. B.1.
Download original image
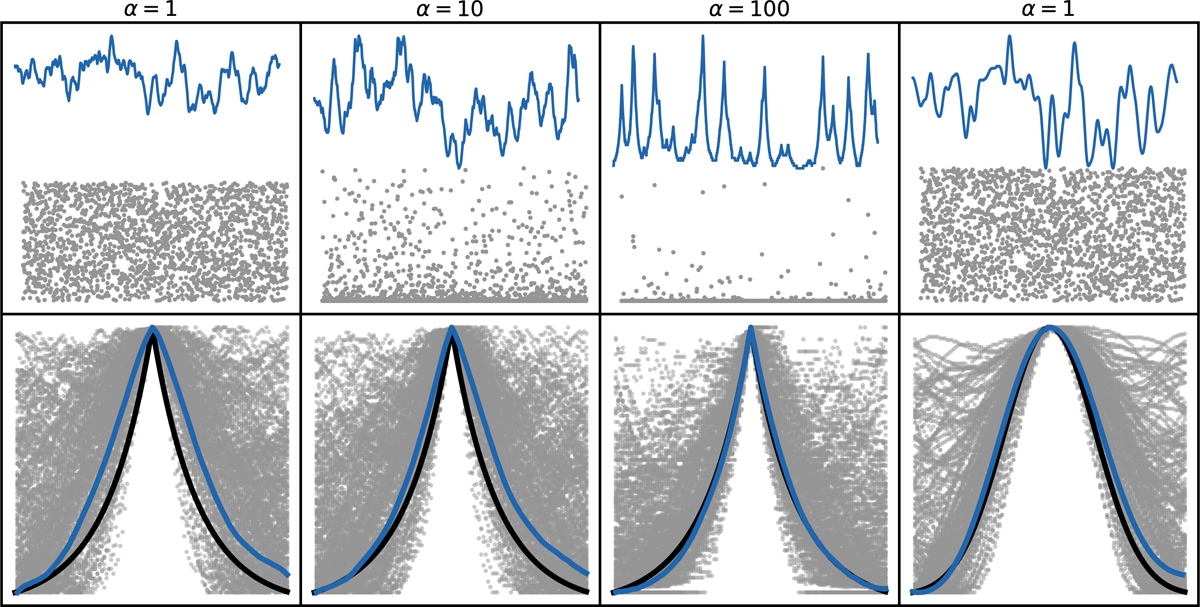
Light curves generated using the MA process and the same random seed, but with differing process parameters. Top panels: Light curve segment (blue line) and innovations R(n)=𝒰α (gray points) for different values of α. Bottom panel: Stacked, shifted, and normalized flares, defined as an isolated peak above the 80% flux percentile (gray dots) in the light curve. The black line illustrates the impulse used in the light curve generation, and the blue shows the first component of a PCA of the data.
Current usage metrics show cumulative count of Article Views (full-text article views including HTML views, PDF and ePub downloads, according to the available data) and Abstracts Views on Vision4Press platform.
Data correspond to usage on the plateform after 2015. The current usage metrics is available 48-96 hours after online publication and is updated daily on week days.
Initial download of the metrics may take a while.