Fig. 1.
Download original image
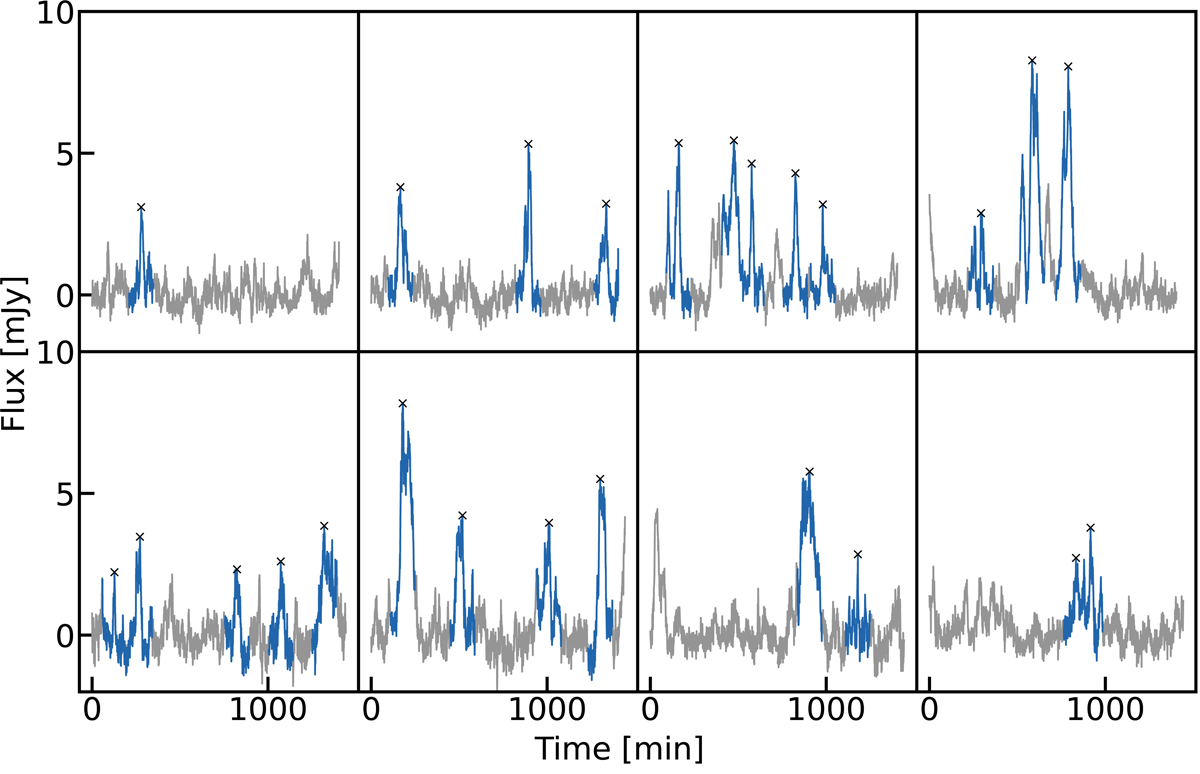
All eight Spitzer epochs plotted alongside one another. The light curves (Witzel et al. 2021) have a typical duration of 24 h and have been binned to one minute. The blue highlighted parts of the light curve show the 25 segments of the light curve in which the observed (i.e., not de-reddened) flux density rose above 2 mJy, and the cross marks show the peak of a flare segment.
Current usage metrics show cumulative count of Article Views (full-text article views including HTML views, PDF and ePub downloads, according to the available data) and Abstracts Views on Vision4Press platform.
Data correspond to usage on the plateform after 2015. The current usage metrics is available 48-96 hours after online publication and is updated daily on week days.
Initial download of the metrics may take a while.