Open Access
Fig. B.3.
Download original image
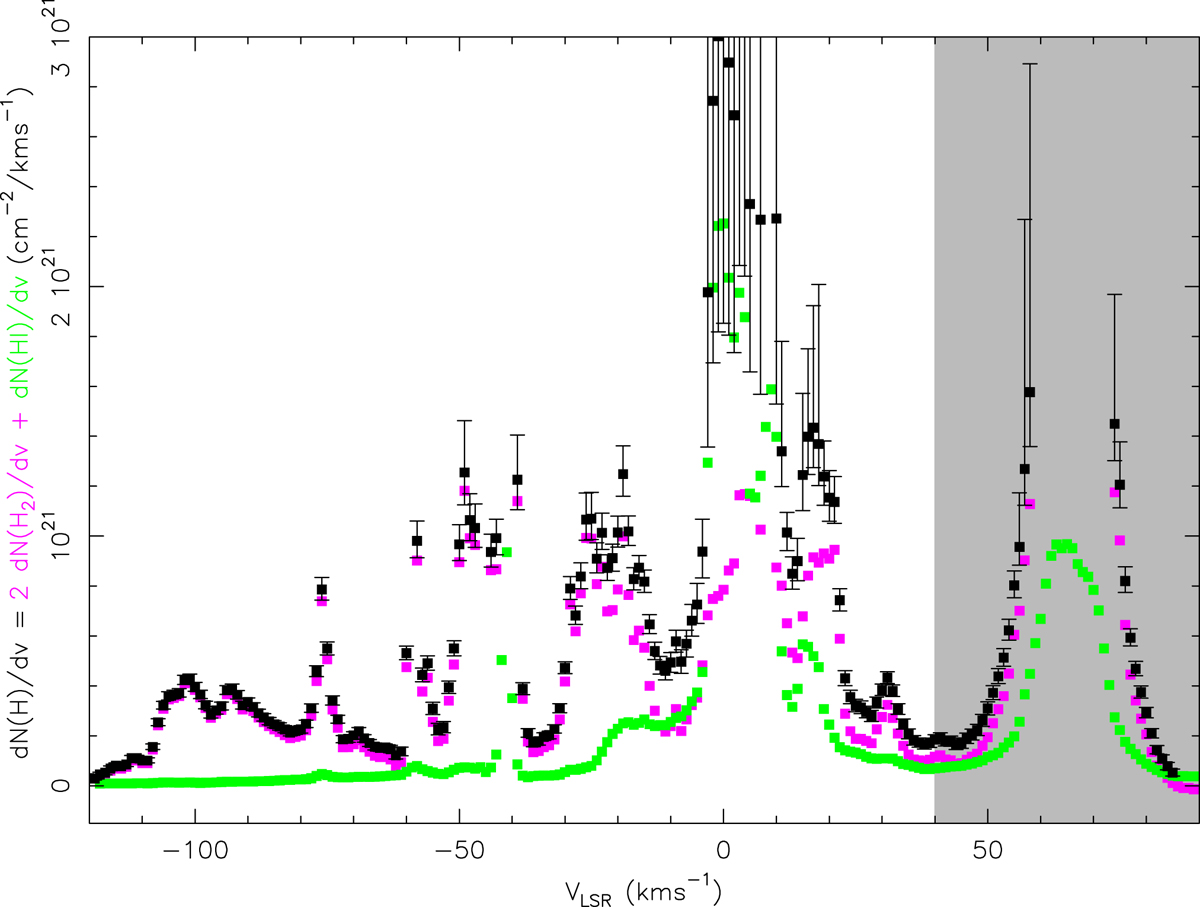
Total hydrogen nucleus column density toward Sgr B2(M) as a function of velocity (black squares). The molecular, 2 × N(H2), and atomic, N(H I), components are shown in cyan and green, respectively. Error bars are ±1σ. An electronic table with the data used for this figure is available at the CDS.
Current usage metrics show cumulative count of Article Views (full-text article views including HTML views, PDF and ePub downloads, according to the available data) and Abstracts Views on Vision4Press platform.
Data correspond to usage on the plateform after 2015. The current usage metrics is available 48-96 hours after online publication and is updated daily on week days.
Initial download of the metrics may take a while.