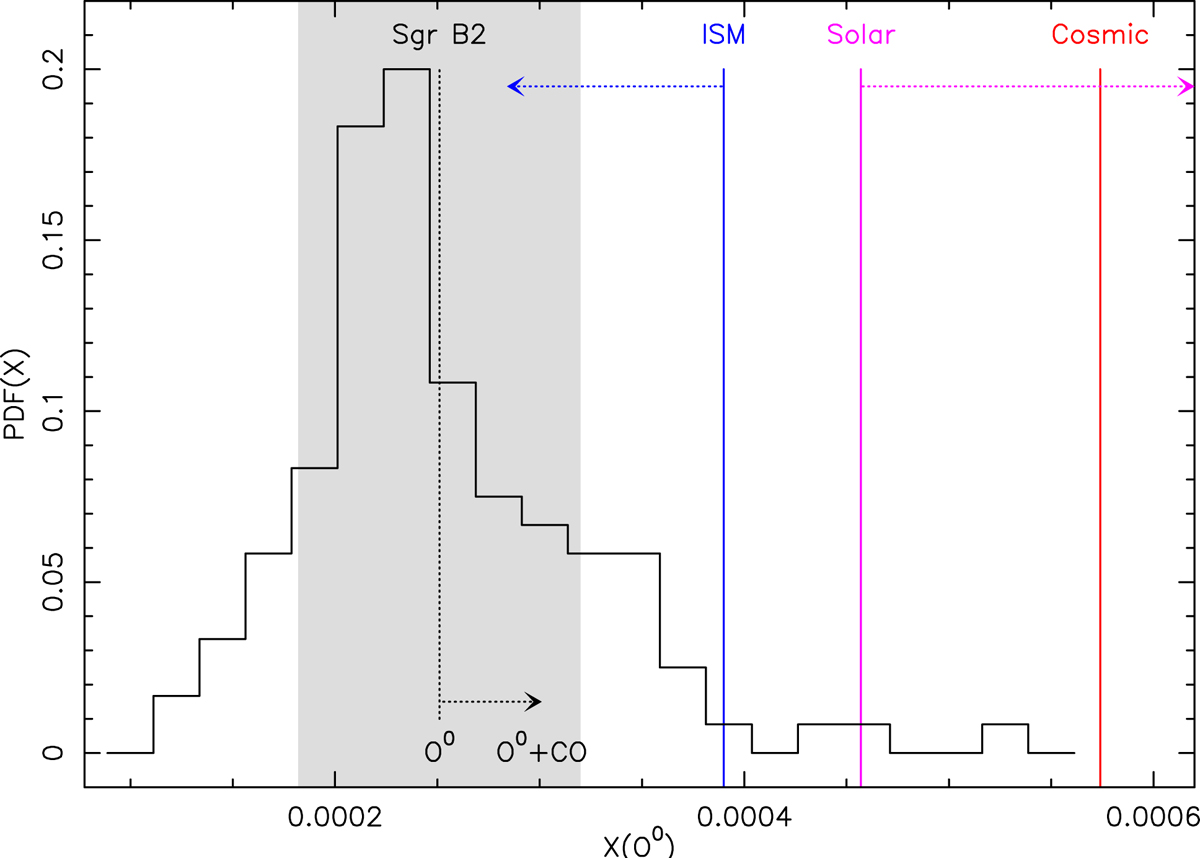
Fig. 3.
Download original image
Normalized probability density function (PDF) of the O0 abundances in 120 individual velocity channels toward Sgr B2. The vertical dashed black line shows the mean abundance, the gray shaded area ±1σ departures from the mean, and the black arrow the corresponding approximate gas-phase oxygen content, including atomic oxygen and CO. The vertical red line shows the cosmic standard abundance (Przybilla et al. 2008) and the magenta line the latest solar abundance (Asplund et al. 2005), with the magenta arrow pointing toward the earlier value of Grevesse & Sauval (1998). The blue line is the average UV-derived ISM abundance in the low-density warm gas that is least affected by depletion, with the blue arrow showing the corresponding value for higher mean density site lines (Cartledge et al. 2004).
Current usage metrics show cumulative count of Article Views (full-text article views including HTML views, PDF and ePub downloads, according to the available data) and Abstracts Views on Vision4Press platform.
Data correspond to usage on the plateform after 2015. The current usage metrics is available 48-96 hours after online publication and is updated daily on week days.
Initial download of the metrics may take a while.