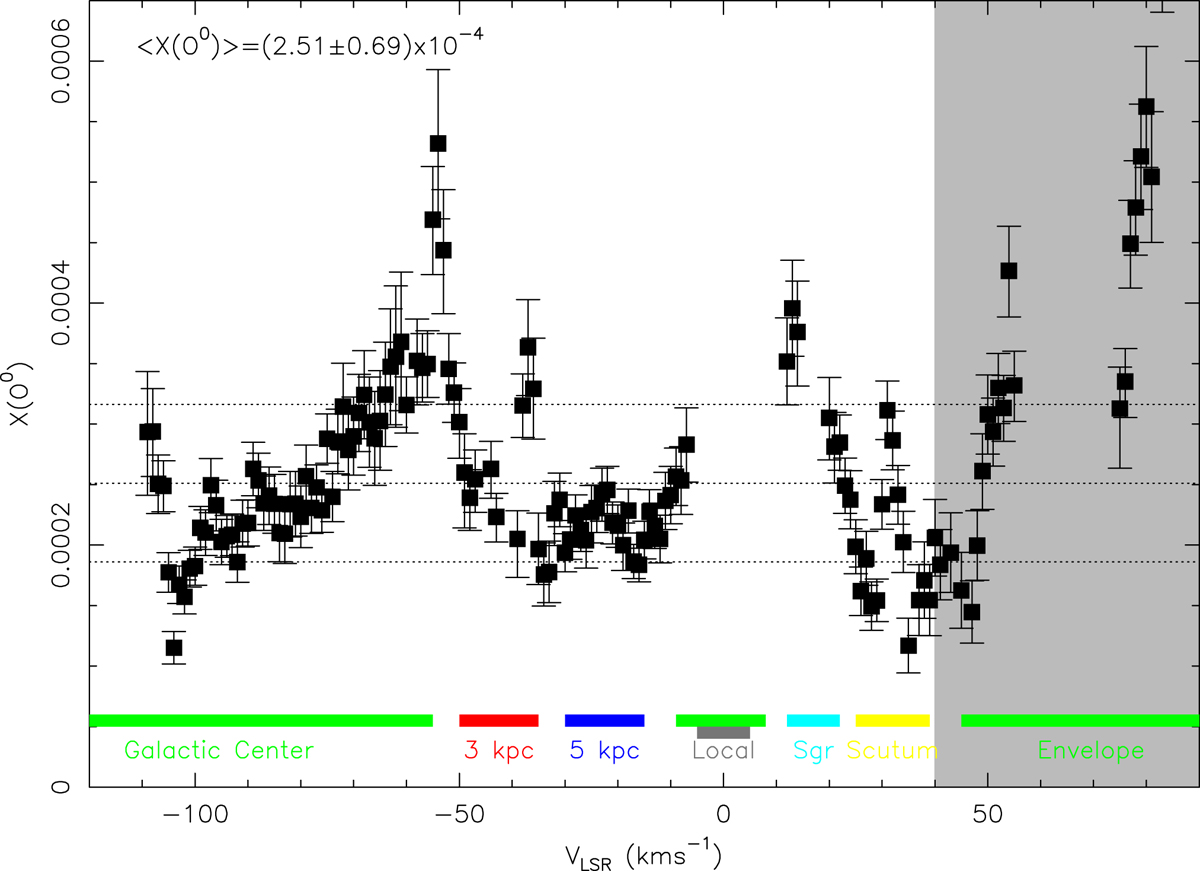
Fig. 2.
Download original image
Atomic oxygen abundance relative to hydrogen nuclei as a function of velocity. The mean value of the 120 individual channels within the −120 and 40 km s−1 velocity range is 2.51 × 10⁻⁴, and the dispersion of the individual channels is 0.65 × 10⁻⁴. The horizontal dotted lines mark the mean value and ±1σ dispersion computed from the ensemble of individual measurements. The black vertical error bars mark ±1σ uncertainties in the individual channels, as described in the text. Color bars mark velocity ranges corresponding to the 3 kpc, 5 kpc, Sagittarius, and Scutum arms (red, magenta, blue, and yellow, respectively). Velocities corresponding to the Galactic center gas are marked in green and those of the local gas in gray. Channels with saturated absorption are masked. An electronic table with the data used for this figure is available at the CDS.
Current usage metrics show cumulative count of Article Views (full-text article views including HTML views, PDF and ePub downloads, according to the available data) and Abstracts Views on Vision4Press platform.
Data correspond to usage on the plateform after 2015. The current usage metrics is available 48-96 hours after online publication and is updated daily on week days.
Initial download of the metrics may take a while.