Fig. 1.

Download original image
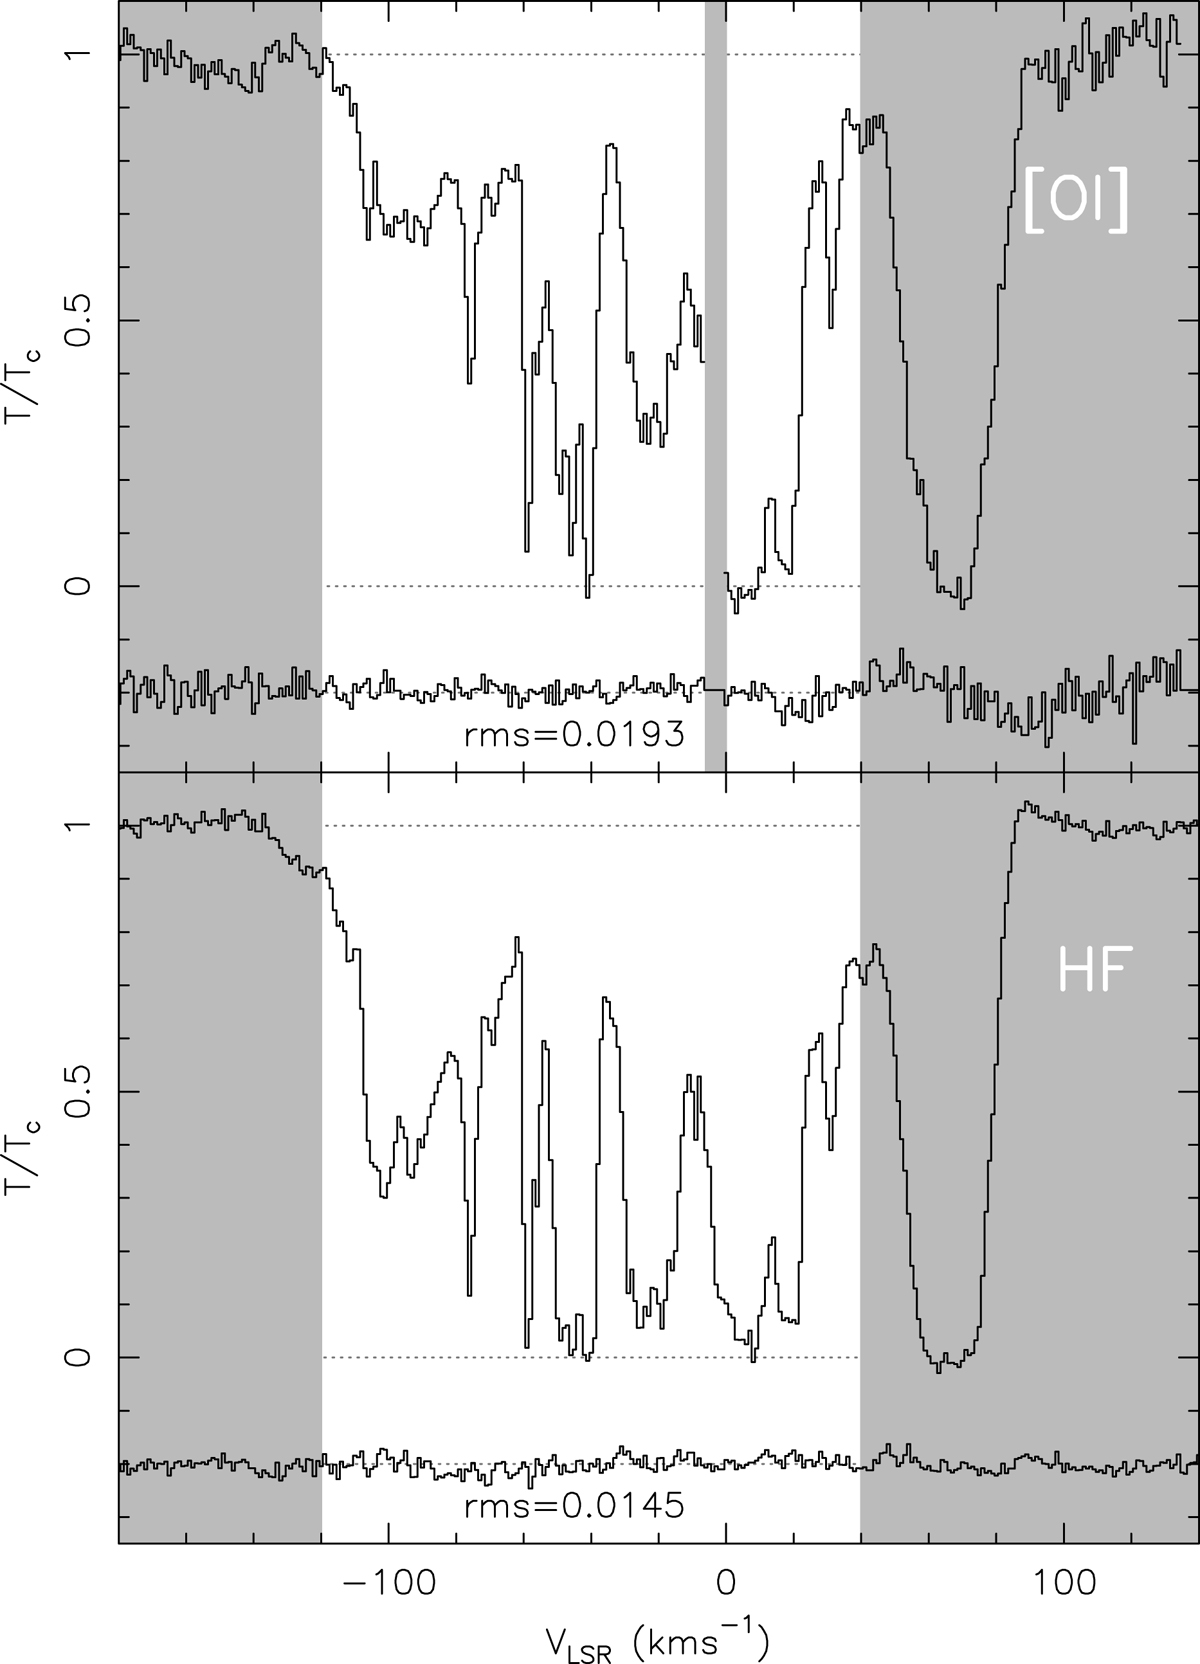
Spectra of [O I] and HF absorption toward Sgr B2(M) divided by the corresponding continua. Upper: SOFIA/GREAT [O I] spectrum. The lower histogram shows the difference between two independent data subsets divided by 2, which is a measure of the uncertainty in the [O I] spectrum. Gray areas show velocities excluded from the analysis. This includes the Sgr B2 envelope at velocities greater than 40 km s−1 and the region between −6 and 0 km s−1, where the [O I] spectrum is contaminated by telluric absorption. Lower: Average Herschel/HIFI spectrum of HF. The lower histogram shows the difference between the two independent observations divided by 2, which is a measure of the uncertainty in the average spectrum.
Current usage metrics show cumulative count of Article Views (full-text article views including HTML views, PDF and ePub downloads, according to the available data) and Abstracts Views on Vision4Press platform.
Data correspond to usage on the plateform after 2015. The current usage metrics is available 48-96 hours after online publication and is updated daily on week days.
Initial download of the metrics may take a while.


