Fig. B.1
Download original image
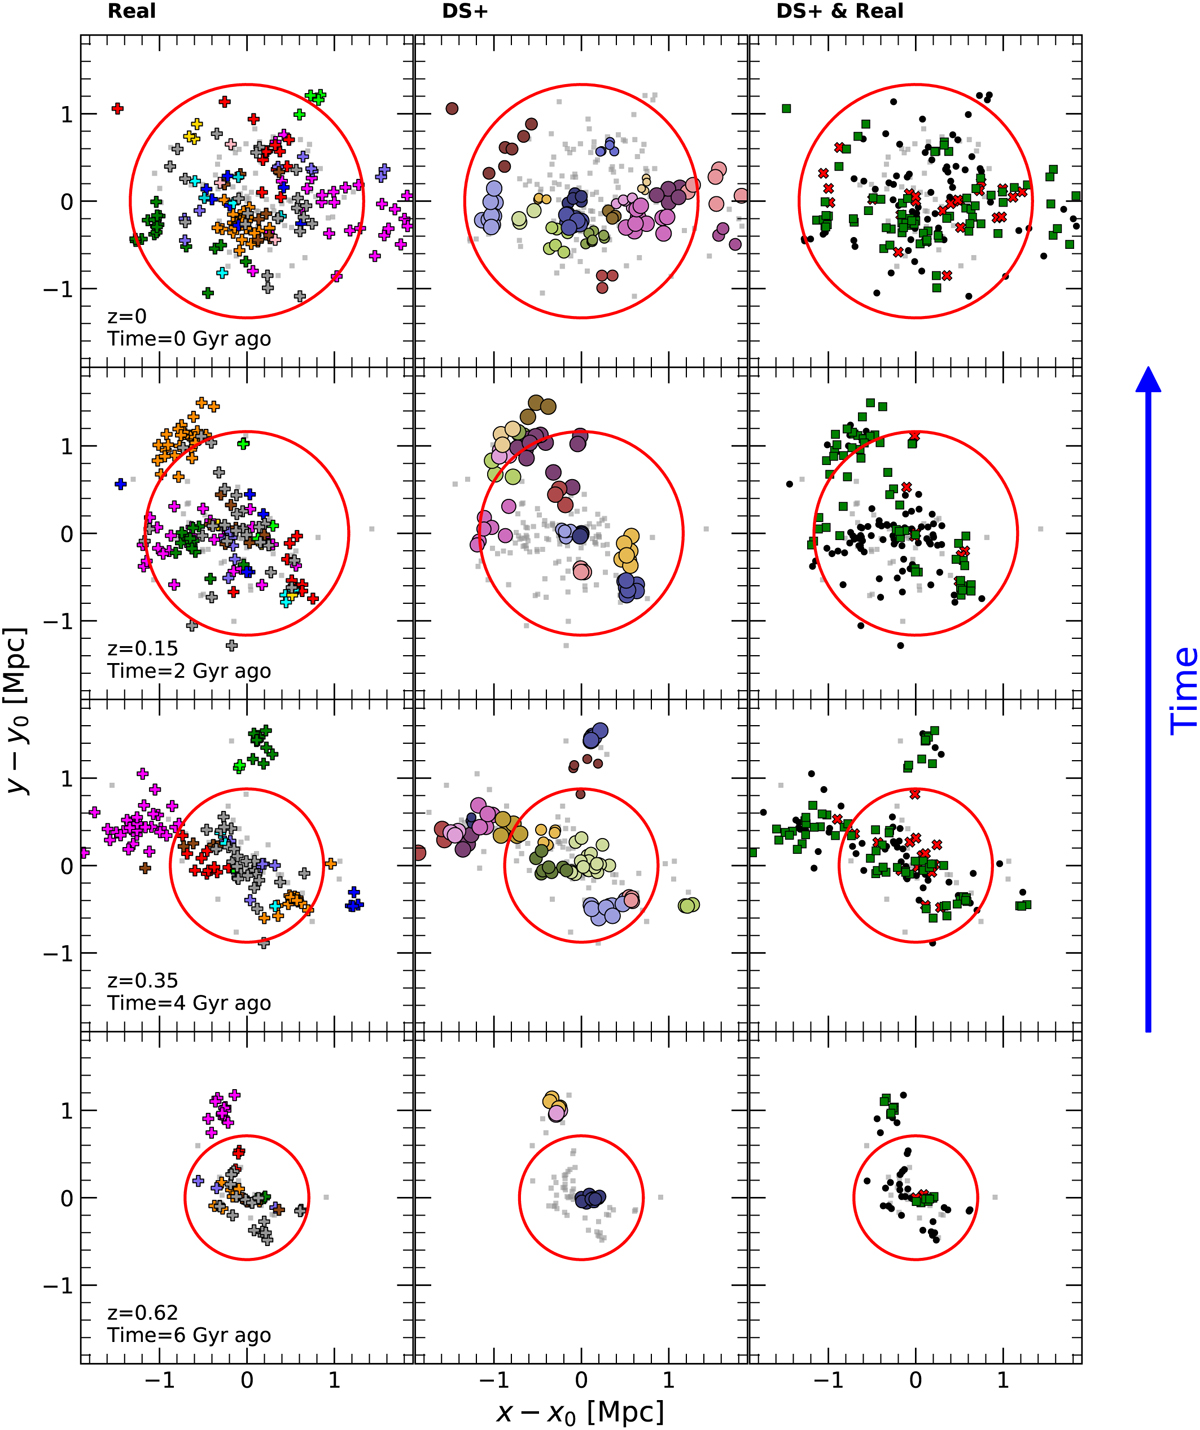
Same cluster as presented in Fig. 1, but for different time snapshots, starting at z = 0 (top panel) and each ~2 Gyr look-back in time, until z ~ 0.62 (bottom panel). Coordinates are in Mpc from the cluster center, defined as the position of the particle with the minimum gravitational potential energy, and the red circle indicates the virial radius of the cluster at the corresponding time.
Current usage metrics show cumulative count of Article Views (full-text article views including HTML views, PDF and ePub downloads, according to the available data) and Abstracts Views on Vision4Press platform.
Data correspond to usage on the plateform after 2015. The current usage metrics is available 48-96 hours after online publication and is updated daily on week days.
Initial download of the metrics may take a while.