Fig. 6
Download original image
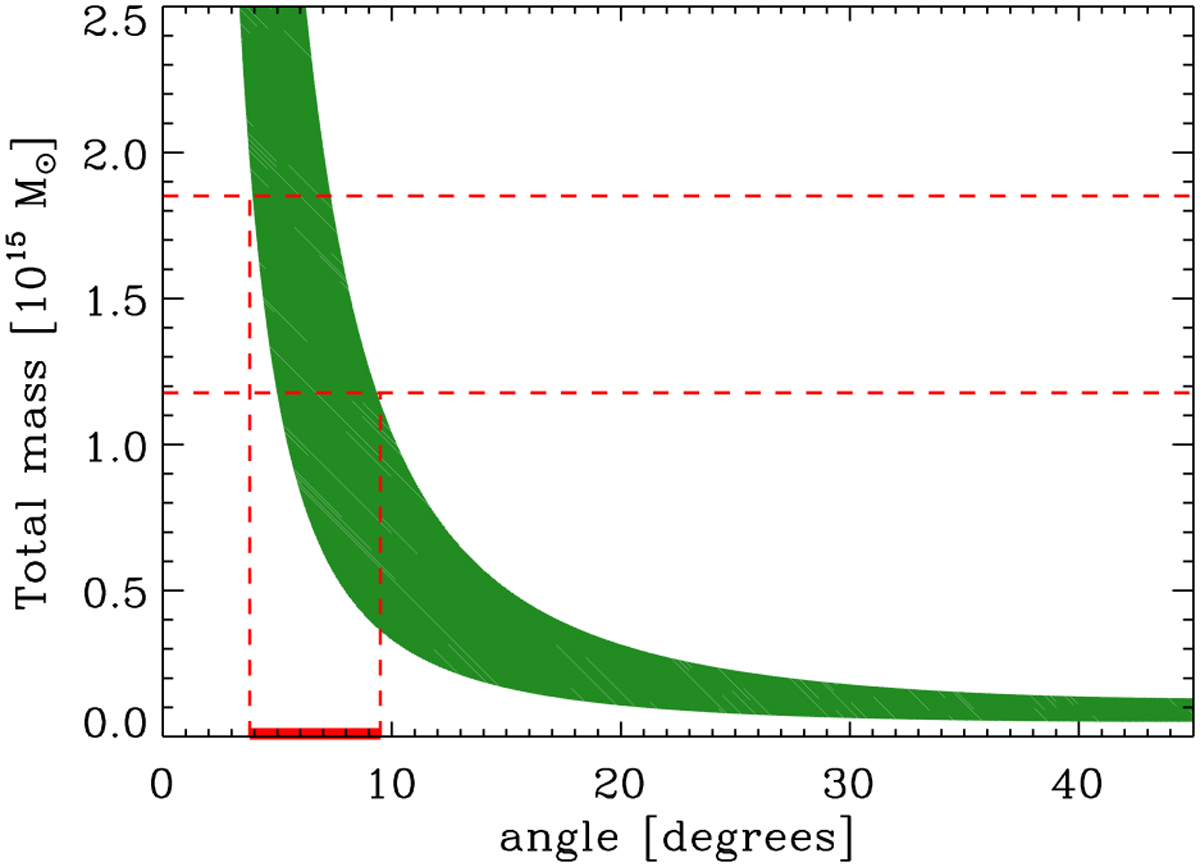
Two-body collision model between the main cluster and the Bullet (group 6 in Table 2). The total mass of the system is shown on the y-axis as a function of the angle of the collision axis with respect to the plane of the sky. The estimated total mass range (1 σ) is illustrated by the two dashed lines. At the intersection of these lines with the model curve, we draw two vertical lines that identify the inferred allowed collision angles (in green on the x-axis), ~4°–10°.
Current usage metrics show cumulative count of Article Views (full-text article views including HTML views, PDF and ePub downloads, according to the available data) and Abstracts Views on Vision4Press platform.
Data correspond to usage on the plateform after 2015. The current usage metrics is available 48-96 hours after online publication and is updated daily on week days.
Initial download of the metrics may take a while.