Fig. 5
Download original image
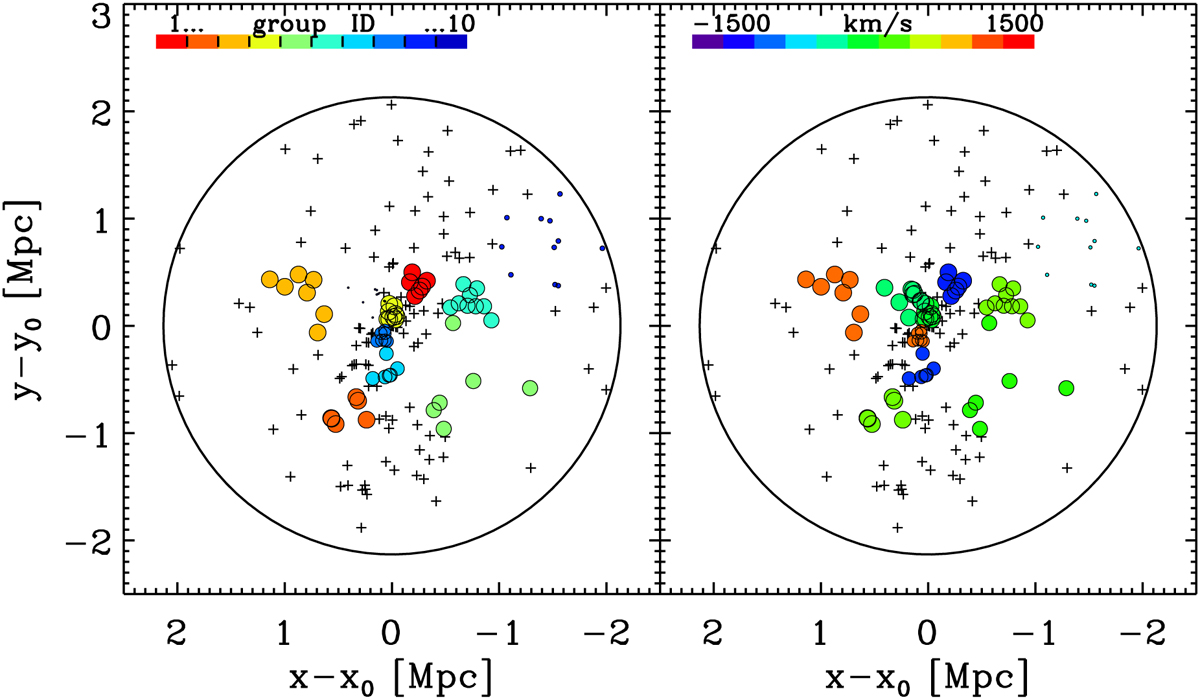
Projected spatial distribution of Bullet member galaxies. North is up, east is to the left. The large black circle has a radius of r200 = 2.13 Mpc and is centered on the cluster center, RA = 104.65139, Dec = −55.95468. Smaller circles (crosses) represent galaxies assigned (not assigned) to substructures by DS+. The size of the circles scales as 1–100 p, where p is the probability of the detected group listed in Table 2. Left panel: different colors identify galaxies assigned to different groups, numbered 1 to 10 as in the inset bar and Table 2. Group 6 is the Bullet, represented by the nine turquoise dots at coordinates (−0.74, 0.22). Right panel: color scale represents the mean velocity of the groups (see Table 2).
Current usage metrics show cumulative count of Article Views (full-text article views including HTML views, PDF and ePub downloads, according to the available data) and Abstracts Views on Vision4Press platform.
Data correspond to usage on the plateform after 2015. The current usage metrics is available 48-96 hours after online publication and is updated daily on week days.
Initial download of the metrics may take a while.