Fig. 4
Download original image
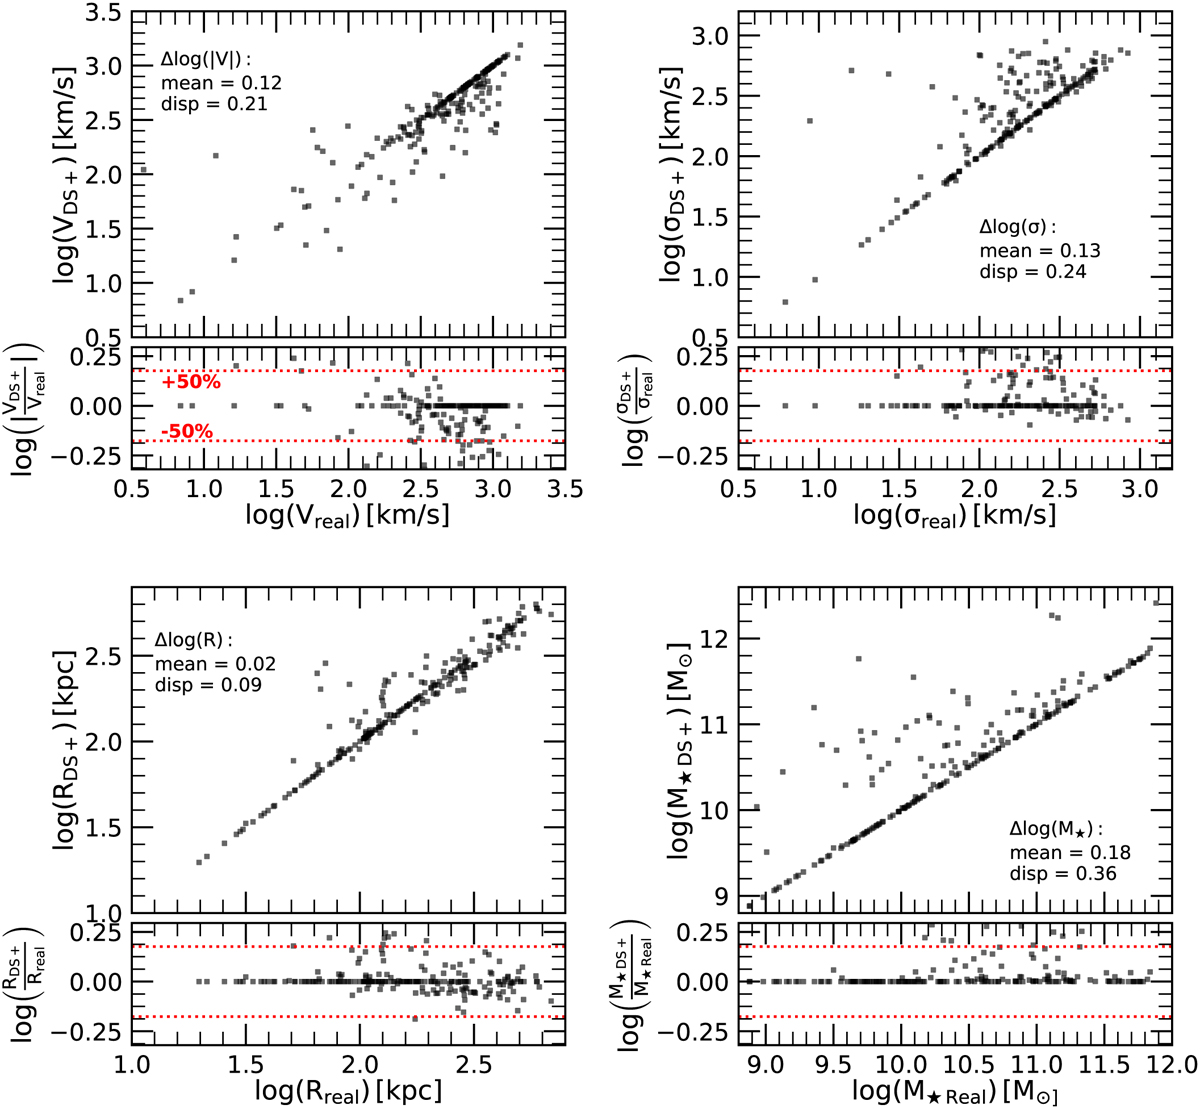
Comparison of different properties of the DS+ no-overlapping substructures with the corresponding ones of the real groups matched to the detected substructures. Top left: mean l.o.s. velocities. Top right: l.o.s. velocity dispersions. Bottom left: projected group size (mean harmonic radius). Bottom right: total stellar mass. In each panel, we include the mean and standard deviation of the differences between the substructure and the matched real group properties. The lower sub-panels show the logarithm of the ratio of the substructure and group properties, and the dotted red lines indicate 50% variations with respect to the ratio of unity.
Current usage metrics show cumulative count of Article Views (full-text article views including HTML views, PDF and ePub downloads, according to the available data) and Abstracts Views on Vision4Press platform.
Data correspond to usage on the plateform after 2015. The current usage metrics is available 48-96 hours after online publication and is updated daily on week days.
Initial download of the metrics may take a while.