Fig. 2
Download original image
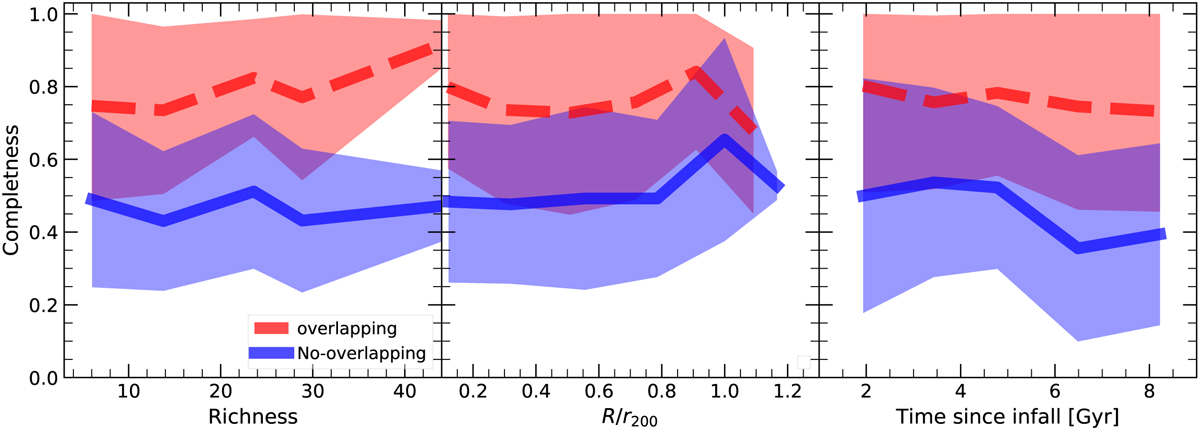
Completeness C of member galaxies of real groups in simulated TNG100 clusters detected by DS+ groups. In all panels, the dashed red line indicates the average over all clusters, using the overlapping mode, and the solid blue line refers to the no-overlapping mode. The filled areas indicate one standard deviation. In all cases, the curves correspond to the stacking of all analyzed clusters. Left: C as a function of the richness of the real groups, corresponding to the number of galaxies detected in substructures. Center: C as a function of the real group cluster-centric distance. Right: C as a function of the time since group infall.
Current usage metrics show cumulative count of Article Views (full-text article views including HTML views, PDF and ePub downloads, according to the available data) and Abstracts Views on Vision4Press platform.
Data correspond to usage on the plateform after 2015. The current usage metrics is available 48-96 hours after online publication and is updated daily on week days.
Initial download of the metrics may take a while.