Fig. 1
Download original image
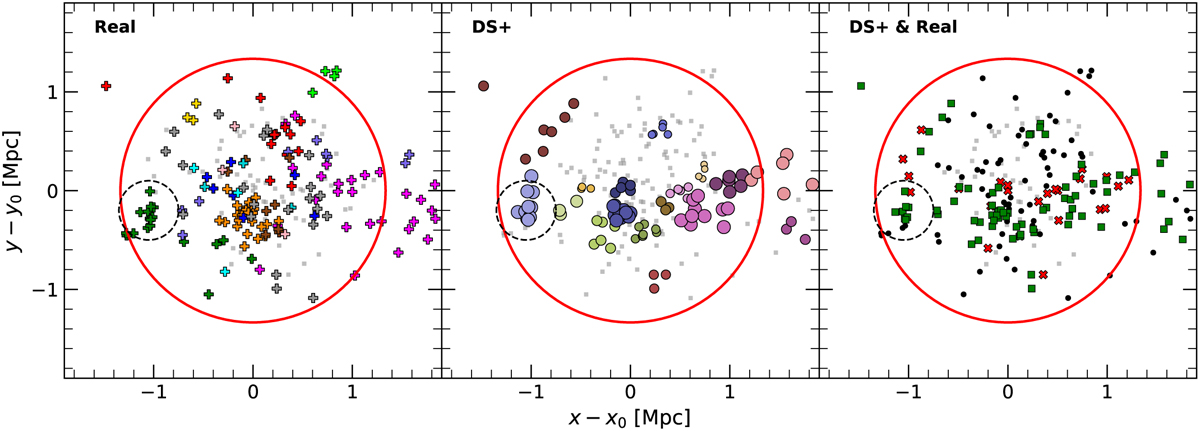
Projected spatial distribution of galaxies in a simulated TNG100 cluster at z = 0, of r200 = 1.3 Mpc and M200 = 2.5 × 10¹⁴ M⊙. In all panels, coordinates are in Mpc from the cluster center, defined as the position of the particle with the minimum gravitational potential energy, the red circle represents the virial radius r200, and the dashed black circle highlights the position of a real group of galaxies that we discuss in the text. Left: crosses correspond to the galaxies that were accreted as part of groups, and gray dots identify the galaxies that entered the cluster individually. Center: circles of different colors identify galaxies assigned to different substructures by DS+ in its no-overlapping mode, the circle sizes being proportional to the individual probability of each DS+ group. Gray dots represent galaxies that were not assigned to any substructure. Right: green squares identify galaxies in real groups that are correctly assigned to substructures by the DS+ method, red crosses indicate galaxies that entered the cluster alone and are incorrectly assigned to substructures, and small black dots identify galaxies that were accreted as part of real groups, but were not assigned to substructures by DS+.
Current usage metrics show cumulative count of Article Views (full-text article views including HTML views, PDF and ePub downloads, according to the available data) and Abstracts Views on Vision4Press platform.
Data correspond to usage on the plateform after 2015. The current usage metrics is available 48-96 hours after online publication and is updated daily on week days.
Initial download of the metrics may take a while.