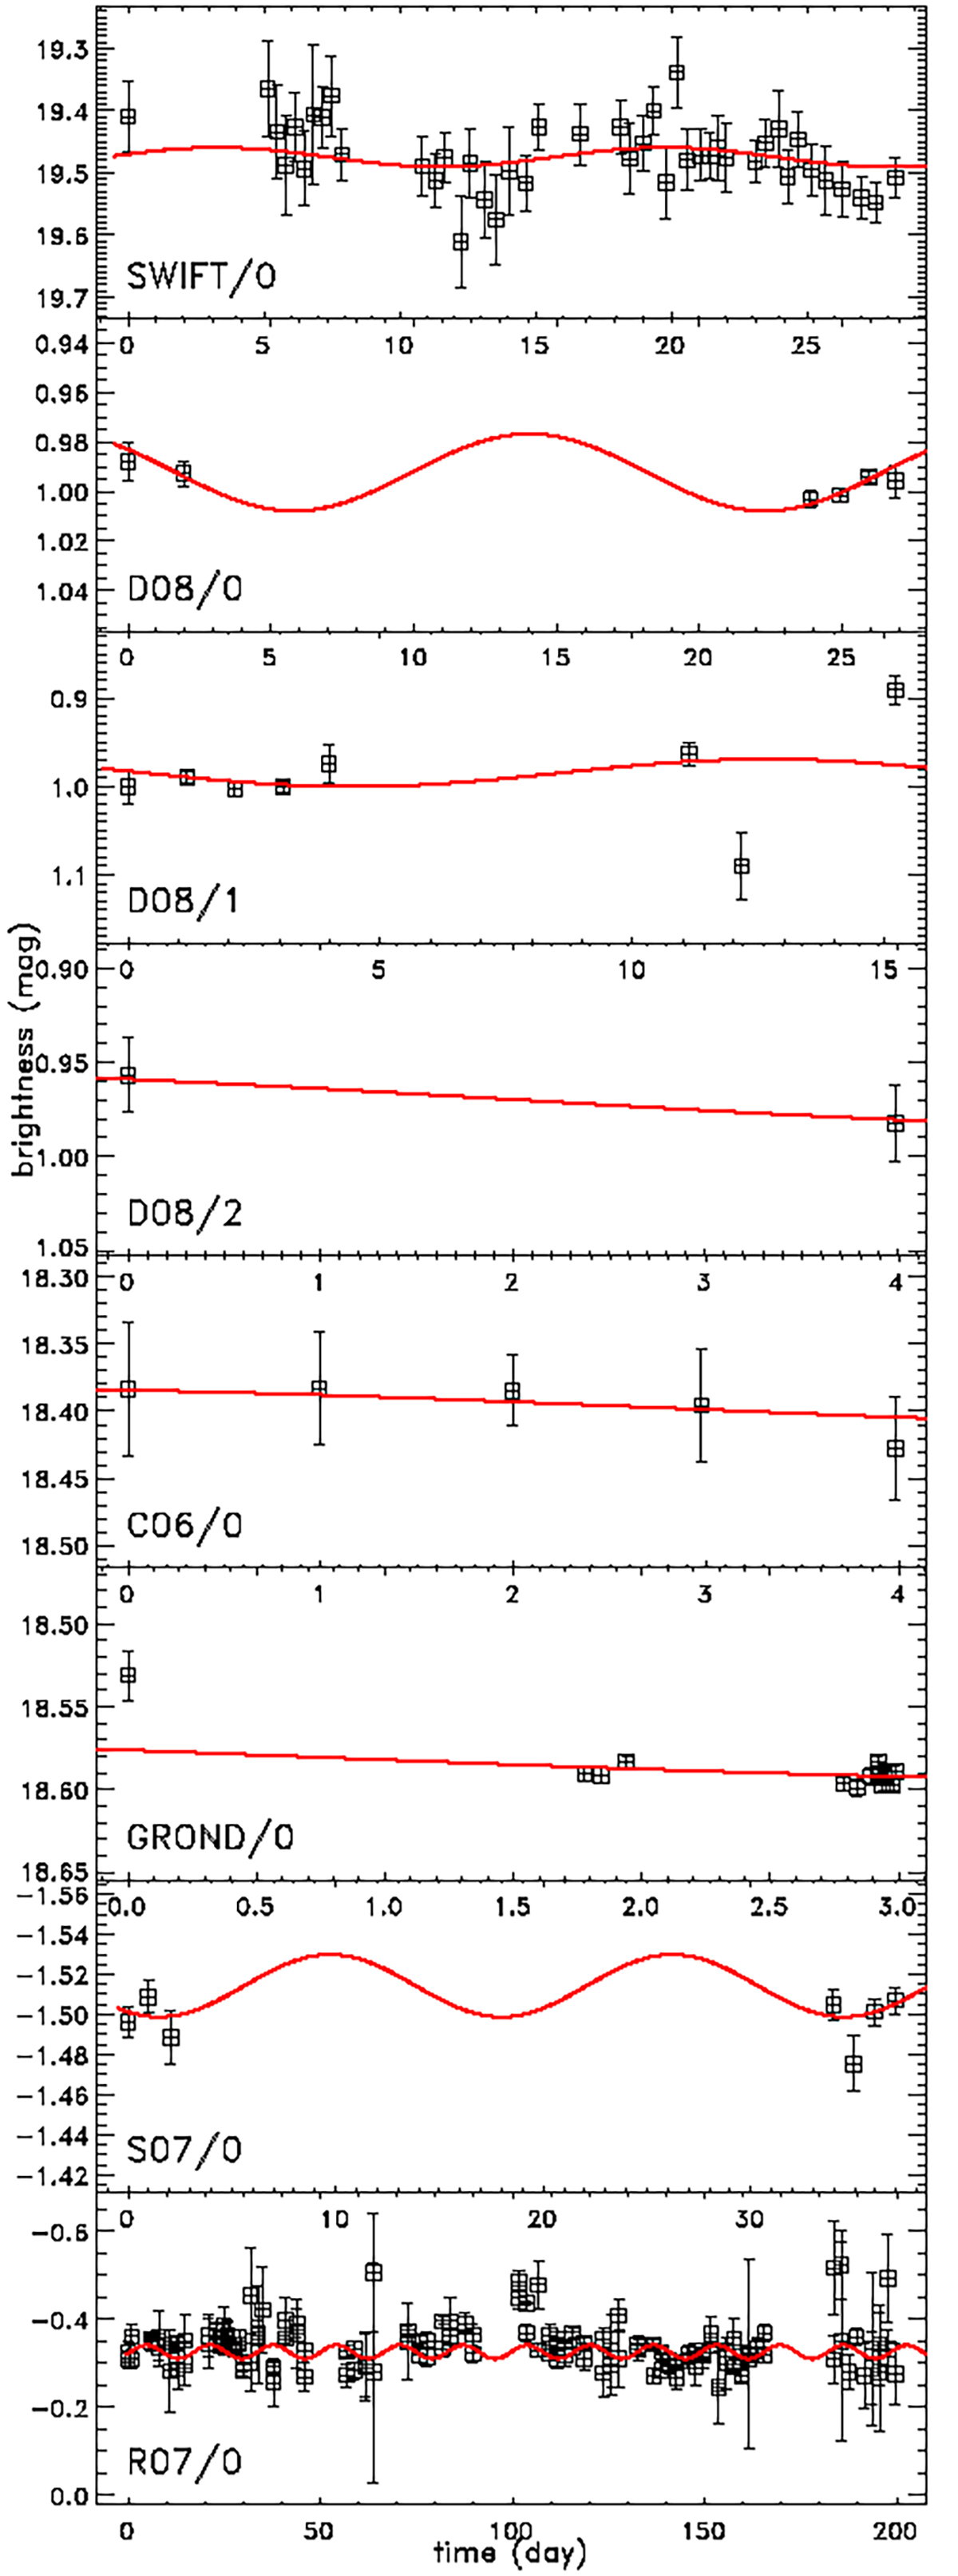
Fig. A.5.
Download original image
Best-matching sine functions (red curve, 15.78 d, i.e. the orbital period of Dysnomia) fitted to the long term photometry data of Eris for some of telescopes considered in our analysis. Time is defined with respect to the start of the measurement block and brightness is in the actual apparent or reduced system, depending on the telescope and measurement block, as marked in the bottom left corners and described in the text.
Current usage metrics show cumulative count of Article Views (full-text article views including HTML views, PDF and ePub downloads, according to the available data) and Abstracts Views on Vision4Press platform.
Data correspond to usage on the plateform after 2015. The current usage metrics is available 48-96 hours after online publication and is updated daily on week days.
Initial download of the metrics may take a while.