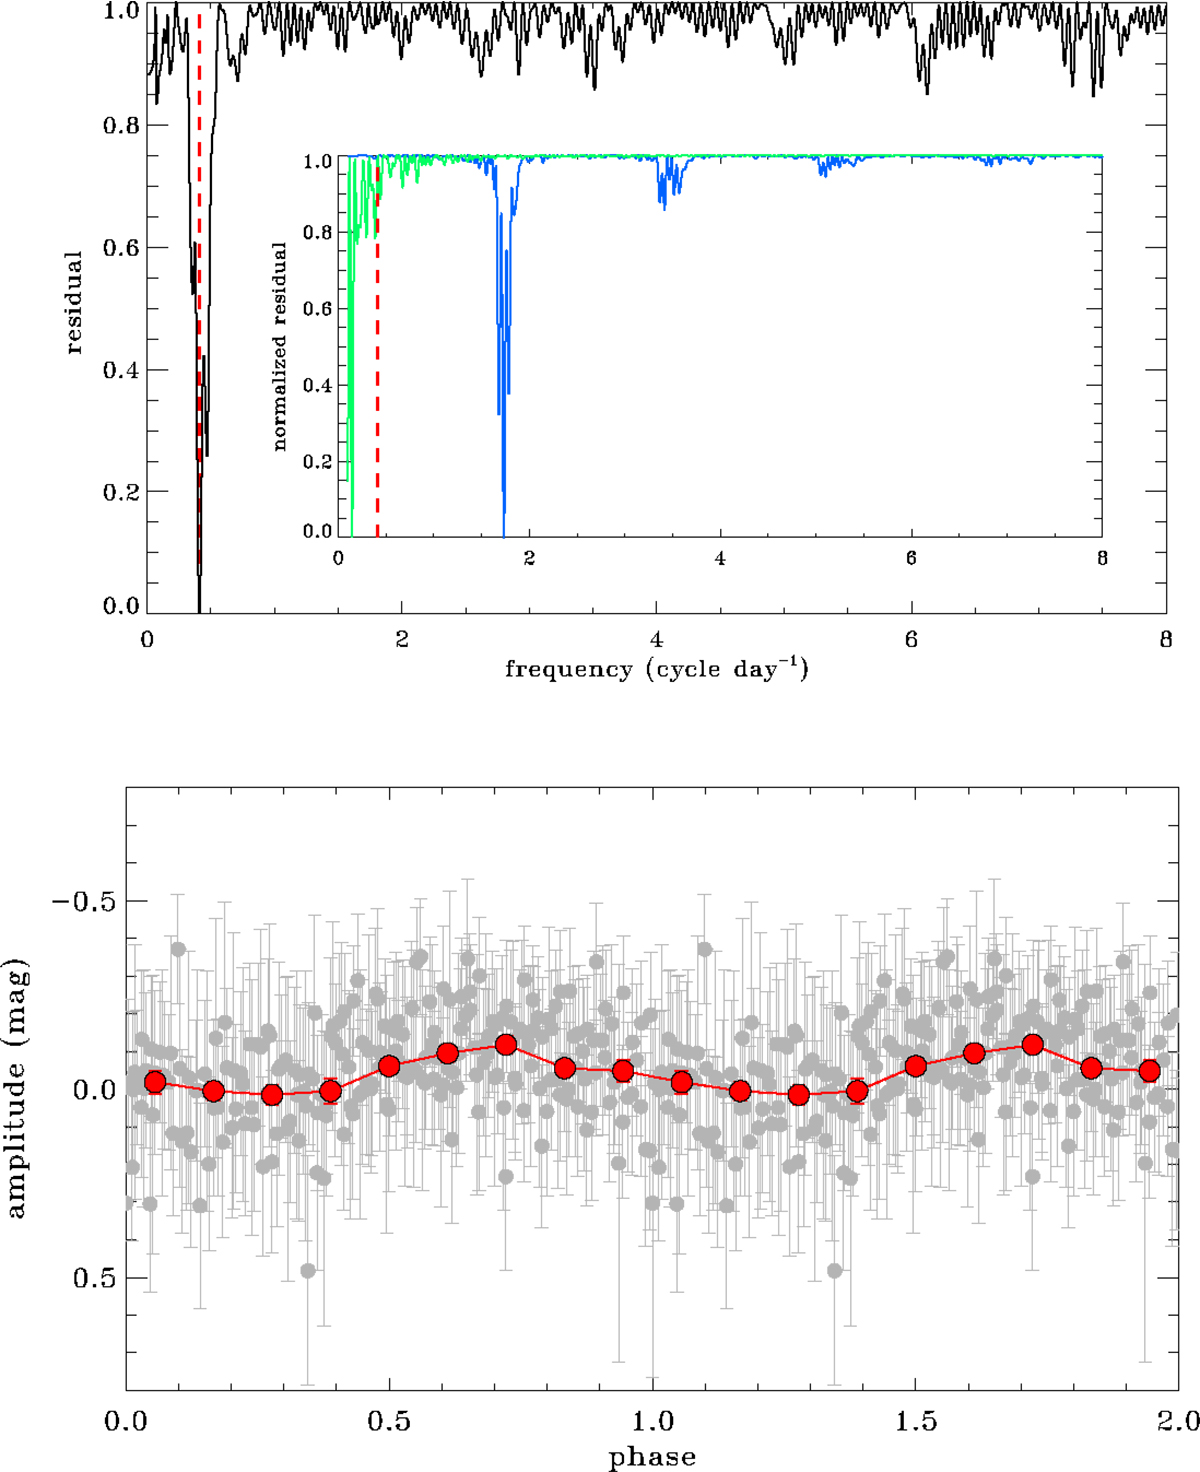
Fig. A.2.
Download original image
TESS light curve results. Top: Normalised residual spectrum of the TESS light curve of Eris. The insert shows the residual spectrum of the pixel-wise x- (blue) and y-direction (green) subpixel centroid positions. The most prominent characteristic frequency of f = 0.411 c/d is marked by a red vertical dashed line both in the main figure and the insert. Bottom: TESS light curve of Eris folded with f = 0.411 c/d. The red dots mark the binned light curve. These light curve data are presented in Table A.1) in an electronically readable format.
Current usage metrics show cumulative count of Article Views (full-text article views including HTML views, PDF and ePub downloads, according to the available data) and Abstracts Views on Vision4Press platform.
Data correspond to usage on the plateform after 2015. The current usage metrics is available 48-96 hours after online publication and is updated daily on week days.
Initial download of the metrics may take a while.