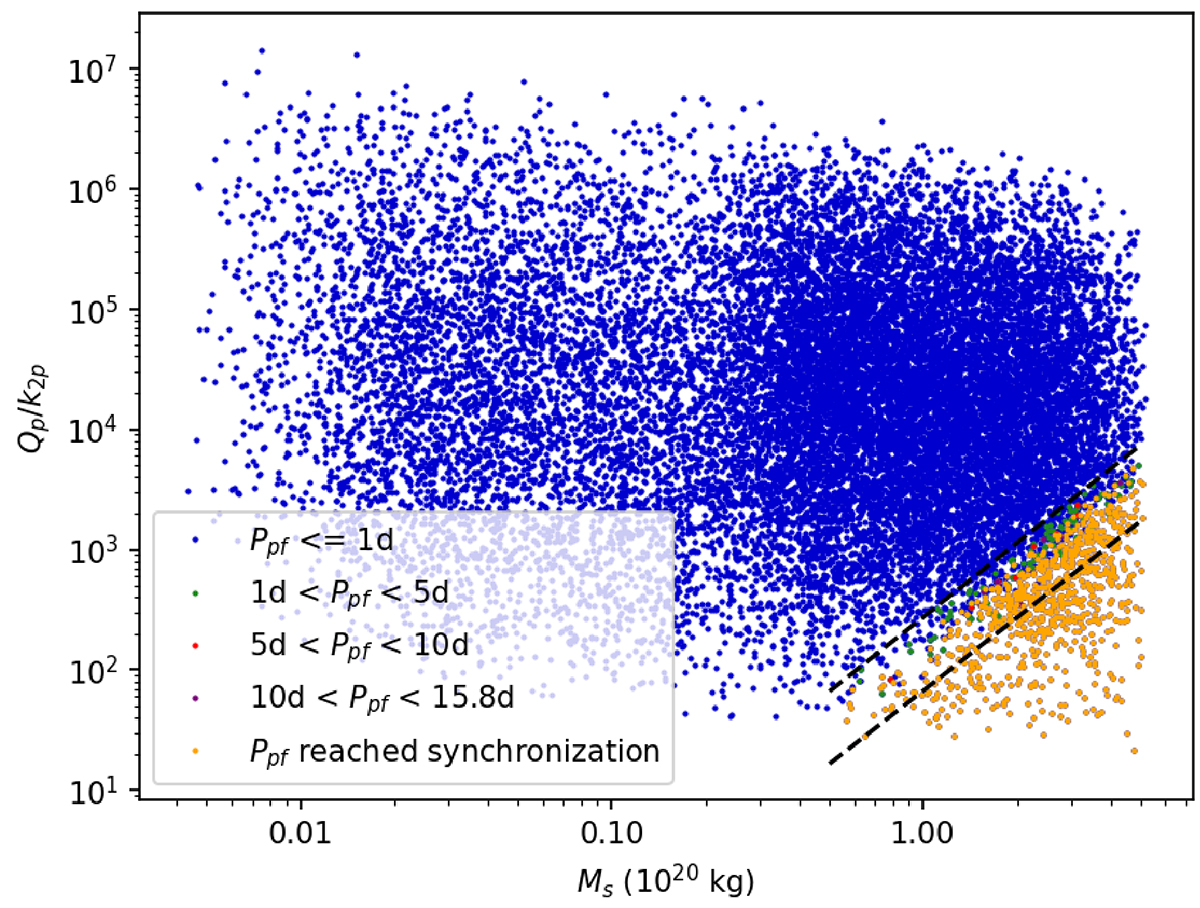
Fig. 3.
Download original image
Qp/k2p vs. the mass of Dysnomia Ms in the first trial runs. Orange symbols mark those cases which ended up in synchronised Eris rotation; blue symbols represent the cases with P < 1 d final Eris rotation periods. Dashed lines mark the region of Ms–Qp/k2p values that lead to a slowed-down rotation or tidal synchronisation of Eris (see text for details).
Current usage metrics show cumulative count of Article Views (full-text article views including HTML views, PDF and ePub downloads, according to the available data) and Abstracts Views on Vision4Press platform.
Data correspond to usage on the plateform after 2015. The current usage metrics is available 48-96 hours after online publication and is updated daily on week days.
Initial download of the metrics may take a while.